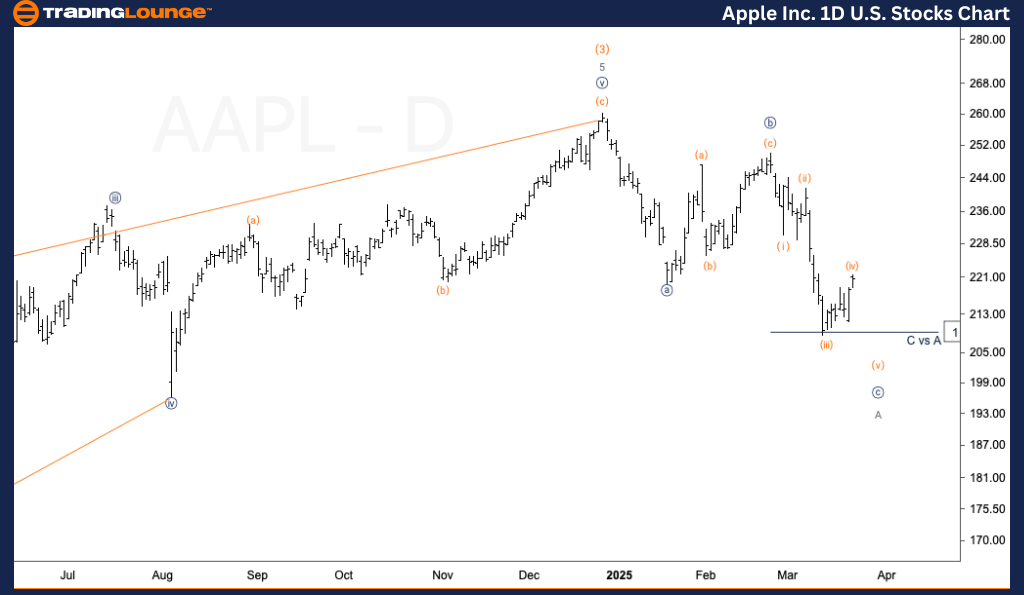
Apple Inc. (AAPL) – In-Depth Elliott Wave Analysis - TradingLounge Daily Chart
AAPL Elliott Wave Technical Analysis
Function: Counter Trend
Mode: Corrective
Structure: ZigZag
Position: Wave {c} of A
Direction: Completing wave A
Details:
This updated Elliott Wave outlook for Apple stock (AAPL) on the daily chart adopts a conservative, long-term view. The current wave pattern aligns with Intermediate wave (4), projected to possibly reach near the 2021 low levels. The ongoing move suggests another decline is required to complete wave A within this corrective phase, pointing to an imminent bottom for wave A.
Apple Inc. (AAPL) – Brief Elliott Wave Analysis
Apple stock (AAPL) remains in a corrective structure, now identified as wave {c} of A, tied to the broader Intermediate wave (4). The daily Elliott Wave chart supports a bearish continuation, with potential downside toward 2021 price levels. The expected final leg in wave A implies a nearing end to the current corrective wave.
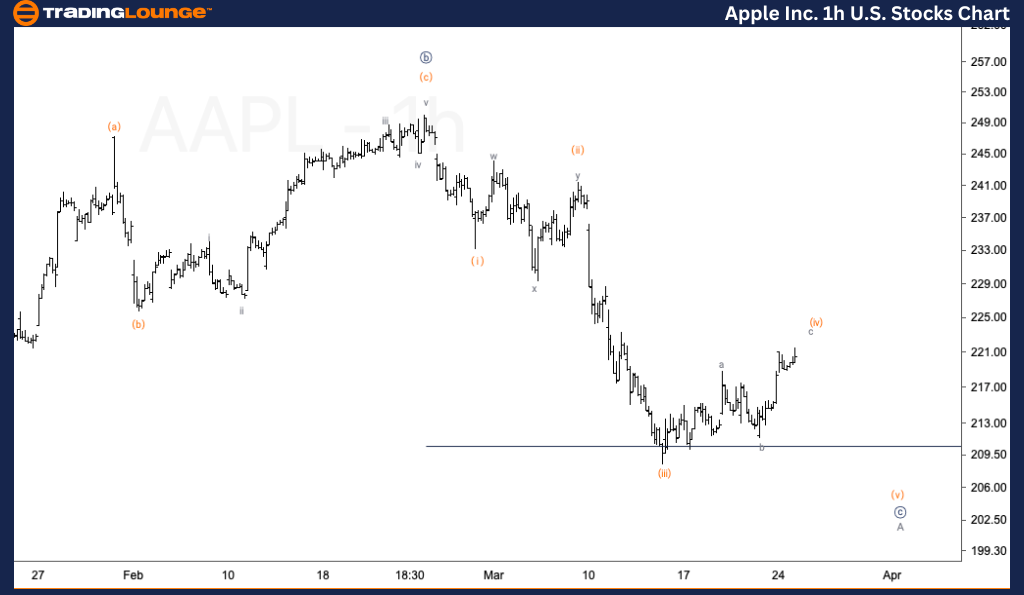
Apple Inc. (AAPL) – In-Depth Elliott Wave Analysis – TradingLounge1H Chart
Function: Counter Trend
Mode: Corrective
Structure: ZigZag
Position: Wave (iv) of {c}
Direction: Further downside
Details:
The short-term AAPL Elliott Wave analysis on the 1-hour chart indicates that wave (iv) within wave {c} is almost done. A continuation to the downside is likely as wave (v) of {c} unfolds, suggesting further bearish pressure in the near term.
Apple Inc. (AAPL) – Brief Elliott Wave Analysis
The 1-hour technical chart suggests that wave (iv) of {c} is nearly completed, setting the stage for an additional leg down in wave (v). Combined, both charts reflect a bearish short-term AAPL outlook ahead of a possible larger trend reversal.
Technical Analyst: Alessio Barretta
Source: Visit Tradinglounge.com and learn from the Experts. Join TradingLounge Here
Previous: Microsoft Inc. (MSFT) Elliott Wave Technical Analysis
VALUE Offer - Buy 1 Month & Get 3 Months!Click here
Access 7 Analysts Over 200 Markets Covered. Chat Room With Support