DIS Elliott Wave Analysis: Unveiling Market Trends - Daily and 4Hr Charts
Delve into the world of Elliott Wave Analysis as we decode the intricate patterns of The Walt Disney Company (DIS) market trends. Our expert insights from the DIS Elliott Wave Analysis Trading Lounge bring you comprehensive analysis tailored for traders and investors seeking clarity in the market dynamics.
DIS Elliott Wave Technical Analysis
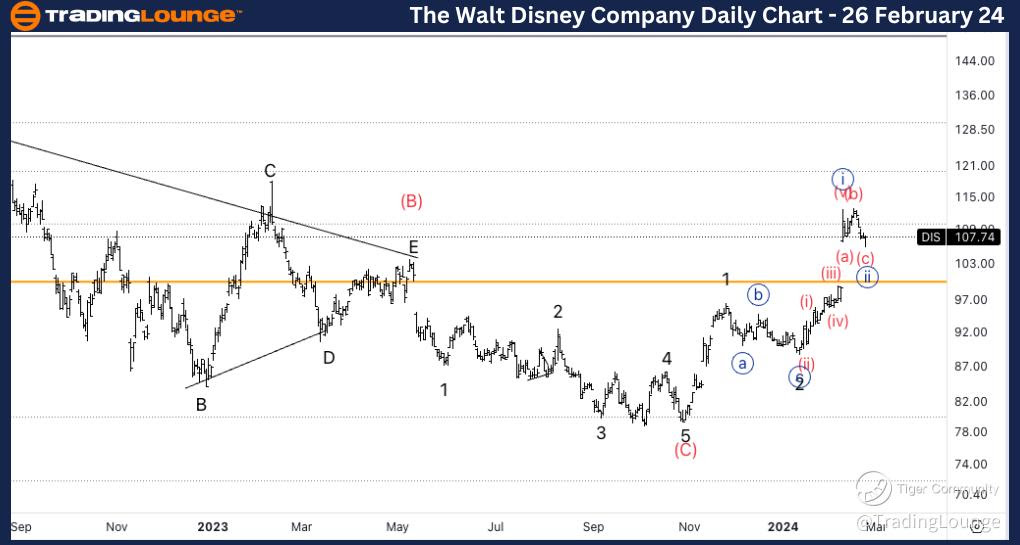
The Walt Disney Company (DIS) Daily Chart Analysis
Embarking on the journey of wave dynamics, we discern a prevailing impulse function adorned with a motive structure on DIS's Daily Chart. Currently positioned within Minute wave {ii} of 3, the outlook hints at potential upward thrust in wave {iii} of 3. Despite the lingering shadows of a major bear market, glimmers of upward movement emerge within DIS. While the prospect of a corrective three-wave ascent looms, the steadfast trading stance above TL1, resting at $100, foreshadows a plausible continuation of the upward trajectory.

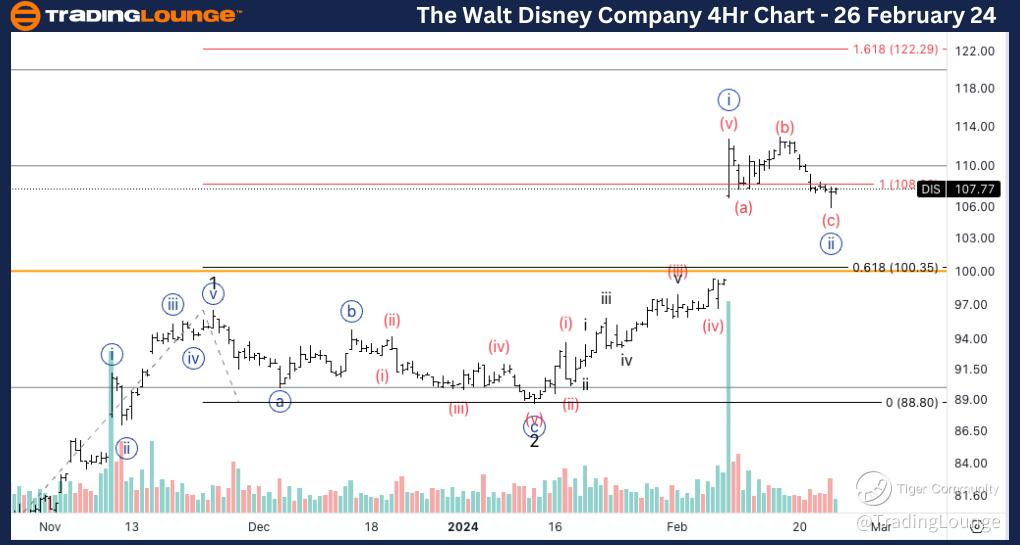
The Walt Disney Company (DIS) 4Hr Chart Analysis:
Navigating through the waves, the 4Hr Chart maintains its impulsive cadence, echoing the motive structure observed in DIS's market trends. Nestled within Wave (c) of {ii}, the current stance sets the stage for a probable surge into wave {iii}. A discernible three-wave pattern unfolds within wave {ii}, accompanied by a surge in volume during the last 4H session, indicative of burgeoning buyer interest. Our gaze shifts towards the $110 mark, envisaging it as a bastion of support, resonating with the potential equality of wave 3 versus wave 1.
Step into the DIS Elliott Wave Analysis Trading Lounge, where every wave tells a story, and every trend unveils an opportunity. Stay tuned for more in-depth analysis and real-time market insights to navigate the waves of DIS with confidence and precision.
Technical Analyst: Alessio Barretta
Source: visit Tradinglounge.com and learn From the Experts Join TradingLounge Here
See Previous: Costco Wholesale Corp.,(COST)
