Corn Elliott Wave Technical Analysis

The ongoing recovery in Corn prices, starting from late August 2024, appears to be a minor correction within the broader bearish trend that began in April 2022. According to Elliott Wave theory, this downward trend remains incomplete, suggesting that after the current bounce, Corn prices will likely face another sell-off, potentially before reaching the $475 level.

Long-Term Outlook: Bearish Corrective Phase

Corn has been in a long-term bearish corrective phase, which began in July 2012. This correction is in response to the five-wave diagonal sequence that originated in the 1970s. Corrective waves, excluding triangles, typically unfold in three-wave patterns. The first wave of this correction ended in April 2020, followed by a significant rally that completed the second wave in April 2022. The subsequent decline from April 2022 is likely the third wave, which could extend down to $295. Therefore, the overall corrective phase remains incomplete, leaving room for further declines in Corn prices.

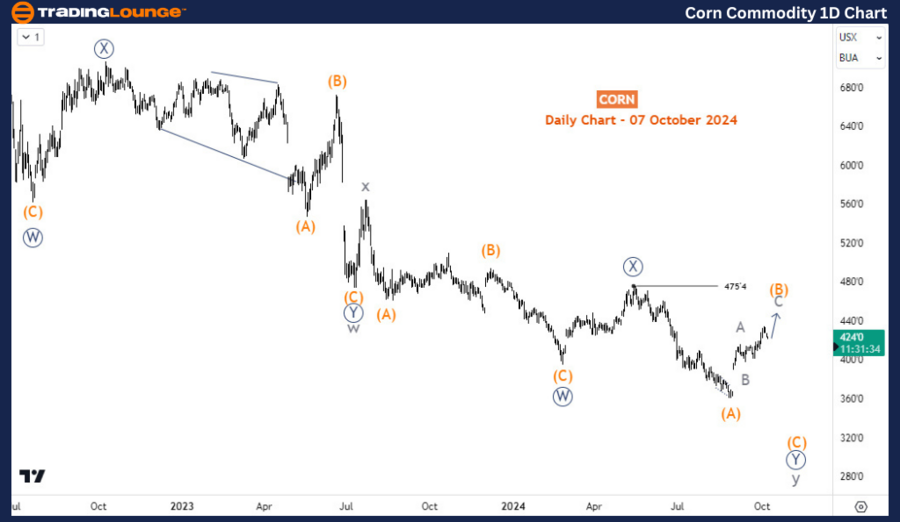
Current Developments on the Daily Chart

The daily chart focuses on the third wave, which appears to be forming a double zigzag pattern in the cycle degree. After completing waves w and x in this cycle, the price is currently within wave y. At present, wave y is incomplete, with the market now in wave (B) of ((Y)) of y. As long as the current bounce in wave (B) does not exceed $475, the downward move in wave (C) could start within the coming weeks. However, if the price breaks above $475, it may indicate the rally from the August 2024 low is part of a new wave ((X)), though in either scenario, a continuation of the downside is expected.

Corn-Commodity-1D-Ch...


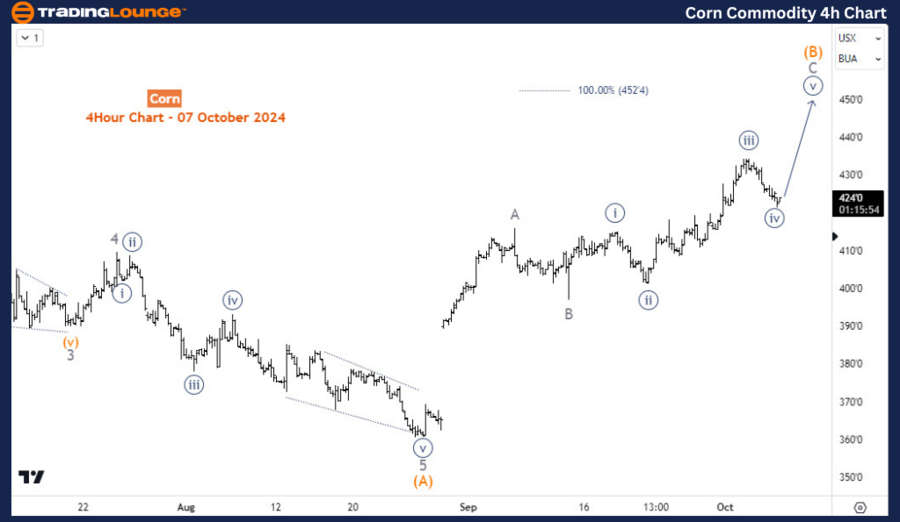
Short-Term Outlook: H4 Chart Focus

On the 4-hour chart, the focus is on the development of wave (B). The price is currently in wave C of (B), which is forming as an impulsive wave. In the short term, an upward move is favored in wave ((v)) of C of (B), targeting the $458-$475 range. This move is expected to be the end of the wave (B), after which the market may begin the next leg down in wave (C).

Technical Analyst: Sanmi Adeagbo

Source: visit Tradinglounge.com and learn From the Experts Join TradingLounge Here 

See Previous: Wheat Elliott Wave Technical Analysis

VALUE Offer - Buy 1 Month & Get 3 Months!Click here

Access 7 Analysts Over 200 Markets Covered. Chat Room With Support

Corn-Commodity-4h-Ch...

Related

Stock Analysis: The Procter & Gamble Company (PG) Elliott Wave Technical Analysis 1 March 24

Stock Analysis: The Procter & Gamble Company (PG) Elliott Wave Technical Analysis 1 March 24

In our PG Elliott Wave Analysis Trading Lounge, we provide comprehensive insights into The Procter &...

Read More >
Forex Analysis Emphasizes Crucial Levels to Watch U.S. Dollar/Japanese Yen (USDJPY) Elliott Wave Technical Analysis

Forex Analysis Emphasizes Crucial Levels to Watch U.S. Dollar/Japanese Yen (USDJPY) Elliott Wave Technical Analysis

This article provides a detailed USDJPY Elliott Wave analysis, covering both daily and 4-hour charts...

Read More >
TSLA Stock Forecast: Tesla Elliott Wave Technical Analysis & Key Price Levels

TSLA Stock Forecast: Tesla Elliott Wave Technical Analysis & Key Price Levels

This comprehensive Elliott Wave analysis of Tesla Inc. (TSLA) provides an in-depth look at both dail...

Read More >
Using Elliott Wave Theory We Forecast Potential Shifts in DE Stock: Deere & Co Stock Current Market Trends and Movements

Using Elliott Wave Theory We Forecast Potential Shifts in DE Stock: Deere & Co Stock Current Market Trends and Movements

This detailed Elliott Wave analysis of Deere & Co. (DE) highlights current market trends and price m...

Read More >
Australian Dollar/U.S.Dollar (AUDUSD) Elliott Wave Technical Analysis 9 January 24

Australian Dollar/U.S.Dollar (AUDUSD) Elliott Wave Technical Analysis 9 January 24

AUDUSD Elliott Wave Analysis dated 9 January 24, provides a comprehensive analysis of the Australian...

Read More >
HDFC Life Insurance’s Stocks Forecast  And Elliott Wave Technical Analysis - Price Movements and Projected Resistance Levels

HDFC Life Insurance’s Stocks Forecast And Elliott Wave Technical Analysis - Price Movements and Projected Resistance Levels

This in-depth analysis covers HDFC Life Insurance’s stock forecast using Elliott Wave theory, highl...

Read More >

$1 for 2 Weeks

then $29 a month!

What a Special Offer!

Trade Recommendations

Unleash the power of deversified trading with our comprehensive portfolio, covering 250+ markets:

  • Stock Trades
  • Crypto Trades
  • Forex Trades
  • Commodity Trades
Elliott Wave Analysis

Gain a competitive edge with expert insights and AI-powered Elliott Wave charting into:

  • Global Indices
  • US Stocks & ASX Stocks
  • Forex & Crypto
  • Commodities
Top-Notch Trading Tools

Equip yourself with the tools of success:

  • Real-time Chat rooms
  • Elliott Wave Algorithm
  • Portfolio tools
  • TradingLevels
  • Screener
  • Trading Game
7 Elliott Wave Analysts

Stay ahead of the market with daily charts and insightful videos
Your secret to strategic trading!

JOIN HERE


Welcome to TradingLounge (ASIC A.R.No. 321187), specialists in trades, trading education and technical analysis, covering stocks, indices, commodities, forex and cryptocurrencies.

When you join TradingLounge you have access to everything we offer, including trade tools, educational content and a social platform to chat with like-minded investors.

Read more

@Copyright 2024 by tradinglounge.com

Contact Us

Australian no: 02 4787 6020

International no: +61 (2) 47876020

Pay with:

Find us on