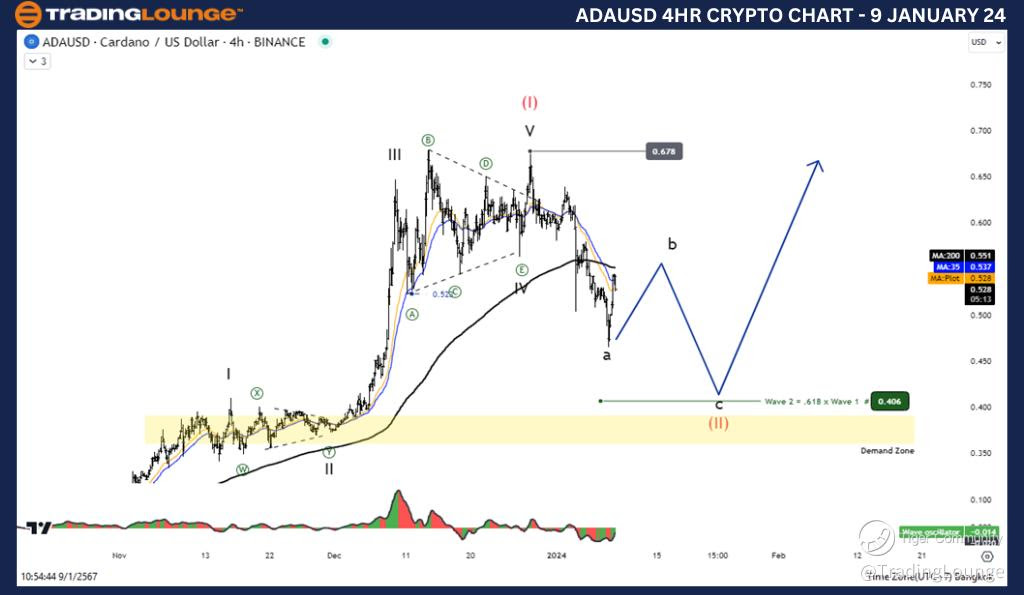
AUDUSD Elliott Wave Analysis Trading Lounge 4 Hour Chart, 9 January 24
Australian Dollar/U.S.Dollar (AUDUSD) 4 Hour Chart
AUDUSD Elliott Wave Technical Analysis
Function: Trend
Mode: Corrective
Structure: blue wave B of black wave 2
Position: Red wave 3
Direction Next Lower Degrees: blue wave C of 2
Details: blue wave 5 of 1 completed at 0.68735 . Now blue B of black wave 2 is in play. Wave Cancel invalid level: 0.68735
The "AUDUSD Elliott Wave Analysis Trading Lounge 4 Hour Chart" dated 9 January 24, provides a comprehensive analysis of the Australian Dollar/U.S. Dollar (AUDUSD) currency pair using Elliott Wave theory. This analysis aims to offer traders valuable insights into the current market dynamics and potential future developments.
The identified "Function" is categorized as "Trend," suggesting that the analysis is focused on understanding the prevailing trend within the market. This indicates an attempt to fit the current price movements into the broader trend context.
The specified "Mode" is labeled as "Corrective," implying that the present market activity is part of a corrective phase. Corrective phases typically involve price movements against the prevailing trend, characterized by a temporary interruption or reversal.
The primary "Structure" is described as "blue wave B of black wave 2." This signifies that the market is currently undergoing a correction labeled as B within the larger Elliott Wave count of black wave 2. Traders use this information to gauge the potential duration and scope of the ongoing correction.
The identified "Position" is labeled as "Red wave 3," offering insights into the position of the current market movement within the broader Elliott Wave sequence. This information is crucial for traders to understand the context of the correction within the overall trend.
In terms of "Direction Next Lower Degrees," the analysis points to the anticipated "blue wave C of 2." This suggests that, following the completion of the current corrective wave B, the market is expected to resume its downward direction as part of the broader corrective structure.
The "Details" section mentions that "blue wave 5 of 1" has completed at 0.68735, signifying the conclusion of the preceding impulsive wave. The market is currently engaged in a corrective
phase labeled as "blue B of black wave 2," providing traders with a reference point for their analysis.
The "Wave Cancel invalid level" is identified as "0.68735," indicating that if the market reaches this level, the current wave count would be invalidated. Traders may need to reassess their analysis in such a scenario.
In summary, the AUDUSD Elliott Wave Analysis for the 4-hour chart on 9 January 24, indicates that the market is currently in a corrective phase labeled as "blue B of black wave 2." Traders are advised to monitor the completion of this correction and be prepared for a potential continuation of the corrective structure toward "blue wave C of 2." The invalidation level at 0.68735 provides a critical point for assessing the accuracy of the Elliott Wave count.
Technical Analyst: Malik Awais
Source: Tradinglounge.com get trial here!

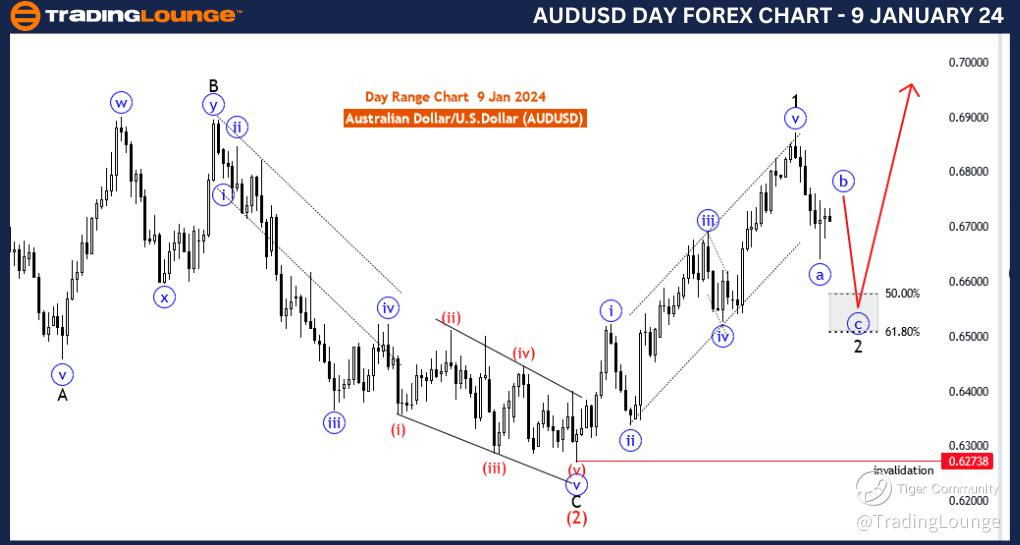
AUDUSD Elliott Wave Analysis Trading Lounge Day Chart, 9 January 24
Australian Dollar/U.S.Dollar (AUDUSD) Day Chart
AUDUSD Elliott Wave Technical Analysis
Function: Trend
Mode: Corrective
Structure: blue wave B of black wave 2
Position: Red wave 3
Direction Next Lower Degrees: blue wave C of 2
Details: blue wave 5 of 1 completed at 0.68735 .Now blue B of black wave 2 is in play . Wave Cancel invalid level: 0.68735
The "AUDUSD Elliott Wave Analysis Trading Lounge Day Chart" dated 9 January 24, offers an in-depth analysis of the Australian Dollar/U.S. Dollar (AUDUSD) currency pair using Elliott Wave theory. The purpose of this analysis is to provide traders with valuable insights into the prevailing market conditions and potential future developments.
The identified "Function" is categorized as "Trend," indicating a focus on understanding the current trend in the market. This suggests an attempt to position the ongoing price movements within the broader trend context.
The specified "Mode" is labeled as "Corrective," suggesting that the current market activity is part of a corrective phase. Corrective phases involve price movements against the prevailing trend, typically characterized by a temporary interruption or reversal.
The primary "Structure" is described as "blue wave B of black wave 2." This suggests that the market is currently undergoing a correction labeled as B within the larger Elliott Wave count of black wave 2. Understanding this correction is essential for traders to gauge the potential duration and scope of the ongoing corrective phase.
The identified "Position" is labeled as "Red wave 3," providing insights into the current position of the market within the broader Elliott Wave sequence. This information is crucial for traders to comprehend the context of the correction within the overall trend.
In terms of "Direction Next Lower Degrees," the analysis points to the anticipated "blue wave C of 2." This indicates that, following the completion of the current corrective wave B, the market is expected to resume its downward direction as part of the broader corrective structure.
The "Details" section mentions that "blue wave 5 of 1" has been completed at 0.68735, signifying the conclusion of the preceding impulsive wave. The market is currently engaged in a
corrective phase labeled as "blue B of black wave 2," providing traders with a reference point for their analysis.
The "Wave Cancel invalid level" is identified as "0.68735," indicating that if the market reaches this level, the current wave count would be invalidated. Traders may need to reassess their analysis in such a scenario.
In summary, the AUDUSD Elliott Wave Analysis for the Day Chart on 9 January 24, suggests that the market is currently in a corrective phase labeled as "blue B of black wave 2." Traders are advised to monitor the completion of this correction and be prepared for a potential continuation of the corrective structure toward "blue wave C of 2." The invalidation level at 0.68735 provides a critical point for assessing the accuracy of the Elliott Wave count.
Technical Analyst: Malik Awais
Source: Tradinglounge.com get trial here!
