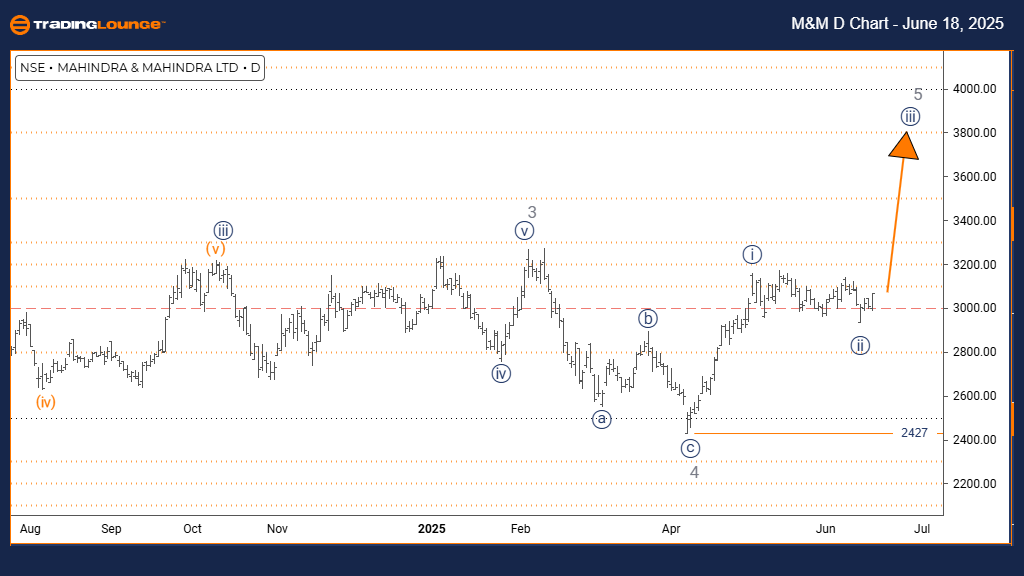
MAHINDRA & MAHINDRA Elliott Wave Analysis | Trading Lounge Day Chart
MAHINDRA & MAHINDRA Elliott Wave Technical Analysis
FUNCTION: Bullish Trend
MODE: Impulsive
STRUCTURE: Navy Blue Wave 3
POSITION: Gray Wave 5
DIRECTION NEXT HIGHER DEGREES: Navy Blue Wave 3 (Initiated)
DETAILS: Completion of Navy Blue Wave 2 confirmed; Navy Blue Wave 3 within Gray Wave 5 is currently unfolding.
Wave Cancel Invalid Level: 2427
The daily Elliott Wave analysis for MAHINDRA & MAHINDRA stock reveals a clearly bullish structure. The current price action is advancing in an impulsive pattern, indicating robust upward momentum. Presently, the market is progressing through Navy Blue Wave 3, which forms part of the broader Gray Wave 5 cycle. This suggests the continuation of a strong, final upward phase in this bullish trend.
The corrective Navy Blue Wave 2 appears to be finalized, initiating the development of Navy Blue Wave 3 within the overarching Gray Wave 5. In Elliott Wave terms, the third wave is commonly the most powerful and typically signals heightened bullish pressure. Traders should closely track the progression of Navy Blue Wave 3 for potential price surges.
A critical level to observe is 2427. If the price closes below this threshold, the current Elliott Wave analysis becomes invalid, and a reassessment of the bullish trend will be necessary. Maintaining price action above this level supports the continuation of the prevailing uptrend.
In summary, MAHINDRA & MAHINDRA’s chart setup points to ongoing bullish momentum. As Navy Blue Wave 3 develops further, buying strength remains evident. However, traders should note that since this wave is part of a fifth-wave sequence, it may represent the concluding leg of the broader upward trend.
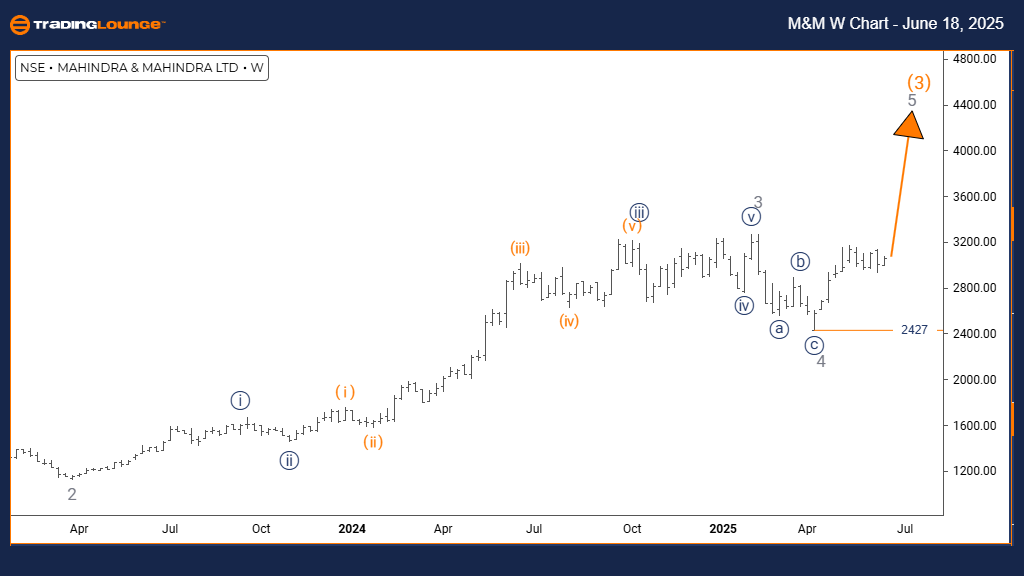
MAHINDRA & MAHINDRA Elliott Wave Analysis | Trading Lounge Weekly Chart
MAHINDRA & MAHINDRA Elliott Wave Technical Analysis
FUNCTION: Bullish Trend
MODE: Impulsive
STRUCTURE: Gray Wave 5
POSITION: Orange Wave 3
DIRECTION NEXT HIGHER DEGREES: Gray Wave 5 (Initiated)
DETAILS: Gray Wave 4 seems complete; Gray Wave 5 has now commenced.
Wave Cancel Invalid Level: 2427
The weekly chart for MAHINDRA & MAHINDRA, interpreted using Elliott Wave principles, maintains a bullish outlook. The price trend remains in an impulsive mode, denoting strong buying pressure. The wave sequence currently unfolding is Gray Wave 5, which is nested within the larger Orange Wave 3 cycle, indicating the late phase of the current upward trend.
Gray Wave 4 appears to have ended, clearing the path for Gray Wave 5 to begin. In Elliott Wave theory, the fifth wave can carry the market to new highs before a potential reversal or larger correction. Traders should observe the behavior of this wave closely as it develops under the influence of Orange Wave 3.
The key invalidation level is 2427. A price movement beneath this line would invalidate the current Elliott Wave structure and suggest a need to reanalyze the trend. Until then, the outlook remains bullish, and upward momentum is expected to persist.
This chart setup implies MAHINDRA & MAHINDRA could continue gaining strength, propelled by Gray Wave 5. Although the impulse structure is strong, the position within a fifth wave suggests that the bullish cycle may be approaching its end stage.
Technical Analyst: Malik Awais
Source: Visit Tradinglounge.com and learn from the Experts. Join TradingLounge Here
Previous: GRASIM INDUSTRIES Elliott Wave Technical Analysis
VALUE Offer - $1 for 2 Weeks then $29 a month!Click here
Access 7 Analysts Over 200 Markets Covered. Chat Room With Support