Corn Elliott Wave Analysis: Understanding the Latest Trends and Predictions

Function: Trend Analysis

Mode: Counter-Trend Movements

Structure: Anticipation of an Impulse Wave

Position: Wave 3 Dynamics

Direction: Ongoing Development of Wave 3

Corn Elliott Wave Technical Analysis

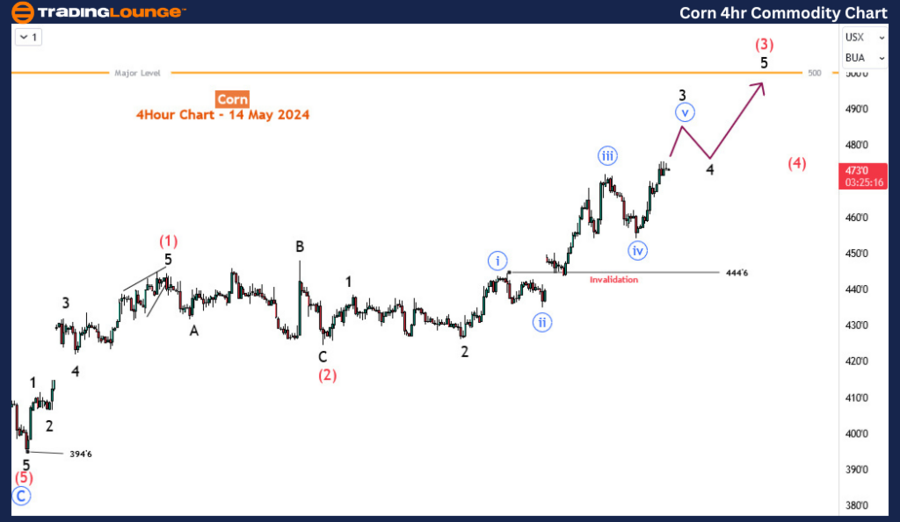
Detailed Overview: Currently, Wave 3 is active and has finished its fourth sub-wave, maintaining a crucial level above 444’6. This positioning suggests a significant rise to complete Wave 3 of (3). The bullish sequence initiated from 394’6 is expected to climb further, as long as the 444’6 mark holds firm. This analysis remains consistent with recent updates.

Market Recovery and Historical Context
Corn prices have experienced a substantial surge, increasing over 20% from the February 2024 low. This rise comes after a severe 22-month downturn, where prices plummeted by nearly 59%. Although the market has shown recovery, it’s still modest compared to the previous downward trend that started in April 2022. Investors are now faced with determining whether the recent uptick is a temporary correction or the start of a robust recovery that could exceed past highs.

Technical Analysis on the Daily Chart
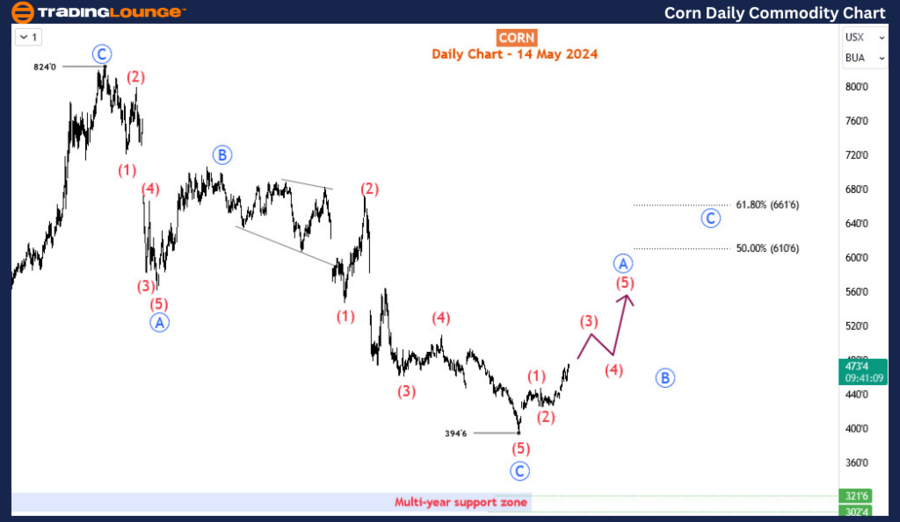
The decline from the April 2022 peak of 824 followed an A-B-C corrective pattern, a stark contrast to the lengthy bullish phase preceding it. If the downturn from June 2022 was merely a market correction, there's potential for the bullish trend to resume. With the sell-off phase concluding, we anticipate either an impulse wave recovery or another A-B-C or W-X-Y pattern to emerge.

Implications of the Current Impulse Wave
The rebound from February 2024 is morphing into an impulse wave, potentially marking the beginning of a recovery sequence. Simplifying our analysis to an A-B-C recovery allows us to foresee the continuation of the current bullish impulse, aiming to complete the 'A' wave in the blue on the daily chart. This projection indicates a promising upside for Corn prices in the upcoming weeks.

Corn-Day-Commodity-c...


Short-Term Technical Outlook on the H4 Chart
A closer examination of the H4 chart reveals the final stages of wave 3 of (3), suggesting an approach towards the critical 500 level. At this juncture, prices may face resistance, likely leading to a corrective wave (4). Consequently, the primary wave A (blue circled) on the daily chart is approximately at its midpoint. This analysis supports a bullish outlook for Corn in the near to medium term, with buying on pullbacks recommended as a strategic approach to capitalize on the prevailing upward momentum.

Conclusion
The current Elliott Wave analysis for Corn suggests a continuing bullish trend with potential for significant gains. As the market dynamics evolve, maintaining vigilance on the key levels of 444’6 and 500 will be crucial for traders. The suggested trading strategy focuses on leveraging pullbacks within the bullish trend, aligning with the overall positive market sentiment.

Technical Analyst: Sanmi Adeagbo

Source: visit Tradinglounge.com and learn From the Experts Join TradingLounge Here 

See Previous: Natural Gas Commodity 

Special Trial Offer - 0.76 Cents a Day for 3 Months! Click here

Access 7 Analysts Over 170 Markets Covered. Chat Room With Support

Corn-4Hr-Commodity-c...

Related

British Pound/ Australian Dollar(GBPAUD) Forex Elliott Wave Technical Analysis: Insightful Day and 4-Hour Chart Perspectives

British Pound/ Australian Dollar(GBPAUD) Forex Elliott Wave Technical Analysis: Insightful Day and 4-Hour Chart Perspectives

This article provides a detailed GBPAUD Elliott Wave Analysis, utilizing both day and 4-hour charts ...

Read More >
Invest in Hang Seng Stocks, Explore the Best Options, and Stay Informed: Hang Seng Index Elliott Wave Technical Analysis

Invest in Hang Seng Stocks, Explore the Best Options, and Stay Informed: Hang Seng Index Elliott Wave Technical Analysis

The Hang Seng Index is a pivotal focus for investors seeking to navigate the complexities of the Hon...

Read More >
Discover the latest VanEck Semiconductor ETF (SMH) Stocks Elliott Wave Technical Analysis

Discover the latest VanEck Semiconductor ETF (SMH) Stocks Elliott Wave Technical Analysis

Discover the latest Elliott Wave analysis of the VanEck Semiconductor ETF (SMH) as of May 2024. This...

Read More >
Refining Theta Token/ U.S. Dollar Elliott Wave Analysis: THETAUSD Price Movement and Technical Insights

Refining Theta Token/ U.S. Dollar Elliott Wave Analysis: THETAUSD Price Movement and Technical Insights

Theta Token's Elliott Wave Analysis indicates a corrective phase within an uptrend against the U...

Read More >
Learn the key aspects of NAB Stock Analysis & Elliott Wave Technical Forecast: NATIONAL AUSTRALIA BANK LIMITED

Learn the key aspects of NAB Stock Analysis & Elliott Wave Technical Forecast: NATIONAL AUSTRALIA BANK LIMITED

Stay ahead with our comprehensive analysis of National Australia Bank (NAB) stocks using Elliott Wav...

Read More >
Mastering Market Movements: Navigating Dips with Elliott Wave Analysis for Optimized Trading Strategies

Mastering Market Movements: Navigating Dips with Elliott Wave Analysis for Optimized Trading Strategies

This video provides an insightful update on Elliott Wave Analysis, focusing on the impact of a posit...

Read More >

Buy 1 Month

Get 3 Months!

Special Offer:

Trade Recommendations

Unleash the power of deversified trading with our comprehensive portfolio, covering:

  • Stock Trades
  • Crypto Trades
  • Forex Trades
  • Commodity Trades
Elliott Wave Analysis

Gain a competive edge with expert insights in to:

  • Global Indices
  • US Stocks & ASX Stocks
  • Forex & Crypto
  • Commodities
Top-Notch Trading Tools

Equip yourself with the tools of success:

  • Social Chat
  • Elliott Wave Algorithm
  • Screener
  • TradingLevels
  • Trading Game
7 Elliott Wave Analysts

Stay ahead of the market with daily charts and insightful videos
-Your secret to strategic trading!

JOIN HERE


Welcome to TradingLounge (ASIC A.R.No. 321187), specialists in trades, trading education and technical analysis, covering stocks, indices, commodities, forex and cryptocurrencies.

When you join TradingLounge you have access to everything we offer, including trade tools, educational content and a social platform to chat with like-minded investors.

Read more

@Copyright 2024 by tradinglounge.com

Contact Us

Australian no: 02 4787 6020

International no: +61 (2) 47876020

Pay with:

Find us on