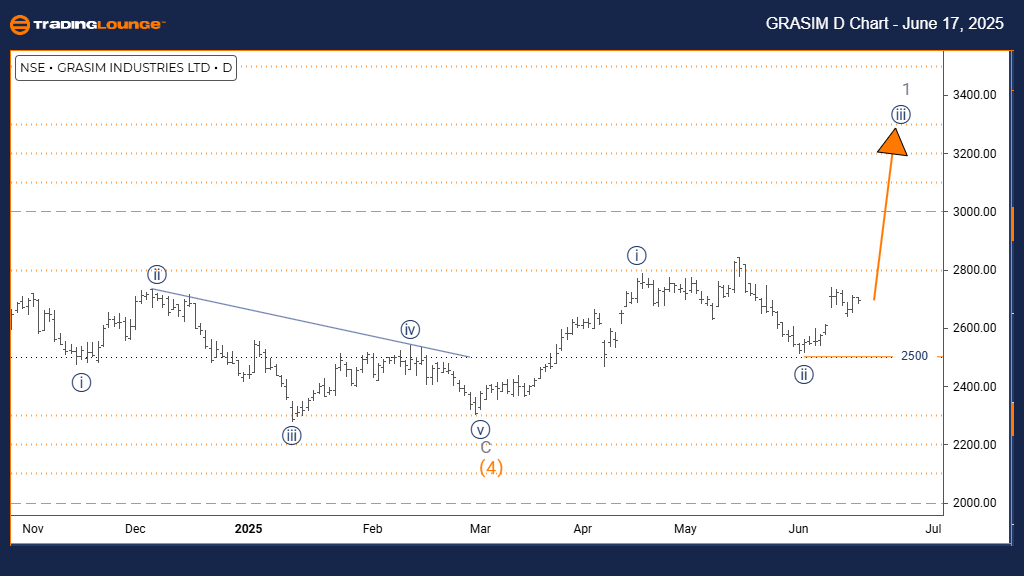
GRASIM INDUSTRIES Elliott Wave Analysis | Trading Lounge Daily Chart

GRASIM INDUSTRIES Elliott Wave Technical Analysis

FUNCTION: Bullish Trend

MODE: Impulsive

STRUCTURE: Navy Blue Wave 3

POSITION: Gray Wave 1

DIRECTION NEXT HIGHER DEGREES: Navy Blue Wave 3 (Initiated)

DETAILS: Navy blue wave 2 appears completed; currently unfolding navy blue wave 3 of wave 1.

Cancel Invalid Level: 2500

The Elliott Wave daily chart for GRASIM INDUSTRIES reflects a bullish Elliott Wave structure. Price momentum is clearly in an impulsive phase, reinforcing strong upward movement in the stock. The identified configuration focuses on navy blue wave 3, embedded within gray wave 1, indicating a core advancement phase in a broader market rally.

Evidence suggests navy blue wave 2 has concluded its corrective action, and the price is now advancing through navy blue wave 3 of gray wave 1. This third wave typically experiences accelerated momentum and sharp price increases, marking the most dynamic segment in an Elliott wave cycle. Current wave analysis implies that navy blue wave 3 has just begun.

A critical support level lies at 2500. Should price fall beneath this threshold, the existing wave outlook would become invalid, requiring a reevaluation of the bullish forecast. Until that occurs, the technical chart maintains a positive market bias.

From a technical standpoint, GRASIM INDUSTRIES appears poised for an extended bullish move. The transition into navy blue wave 3 signals renewed buying interest, pointing to the likelihood of continued price strength and favorable risk-to-reward dynamics.

GRASIM-Stock-Day-Cha...


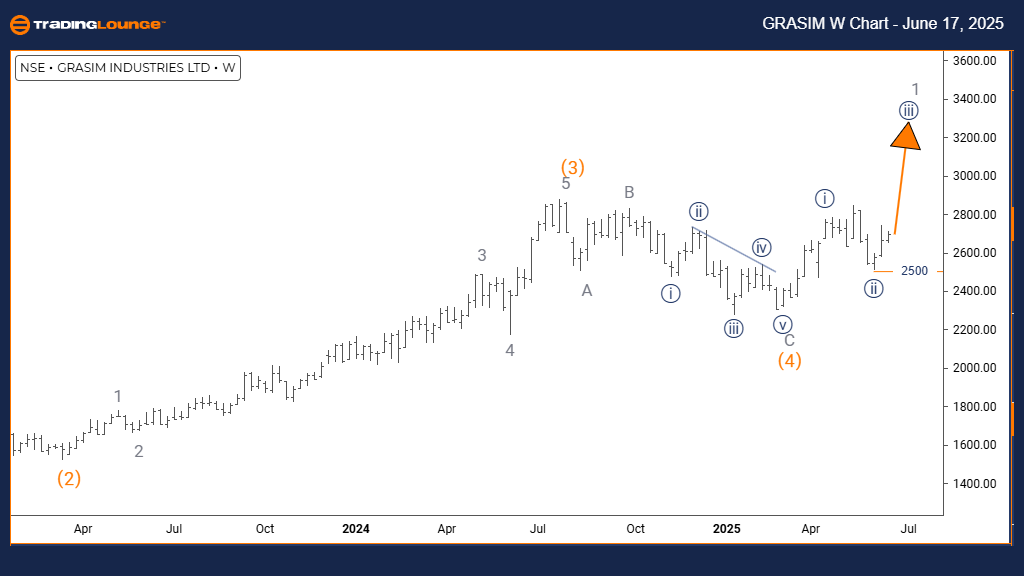
GRASIM INDUSTRIES Elliott Wave Analysis | Trading Lounge Weekly Chart

GRASIM INDUSTRIES Elliott Wave Technical Analysis

FUNCTION: Bullish Trend

MODE: Impulsive

STRUCTURE: Navy Blue Wave 3

POSITION: Gray Wave 1

DIRECTION NEXT HIGHER DEGREES: Navy Blue Wave 3 (Initiated)

DETAILS: Navy blue wave 2 likely completed; navy blue wave 3 of wave 1 is in progress.

Cancel Invalid Level: 2500

The weekly chart analysis for GRASIM INDUSTRIES confirms an impulsive bullish trend as per Elliott Wave Theory. The prevailing market pattern indicates upward momentum, driven by navy blue wave 3 situated within the structure of gray wave 1. This configuration signifies that the stock is currently experiencing the most forceful upward segment in its wave sequence.

Wave analysis confirms navy blue wave 2 has likely finished its correction, initiating the development of navy blue wave 3. Known for producing the steepest price increases, this wave stage tends to attract significant volume and momentum. Close observation of navy blue wave 3's evolution is essential, as it offers vital insight into the continuation of the upward cycle.

The invalid level remains established at 2500. Any move below this line would negate the current bullish pattern and prompt a reassessment. Until such a breach occurs, the technical analysis continues to favor a positive trajectory for the stock.

The Elliott Wave setup implies medium-term growth potential for GRASIM INDUSTRIES. With wave 3 developing after the end of wave 2, the setup suggests strong market sentiment and further upward movement as likely scenarios.

Technical Analyst: Malik Awais

Source: Visit Tradinglounge.com and learn from the Experts. Join TradingLounge Here

Previous: DOW JONES - DJI Elliott Wave Technical Analysis

VALUE Offer - $1 for 2 Weeks then $29 a month!Click here

Access 7 Analysts Over 200 Markets Covered. Chat Room With Support

GRASIM-Stock-w-Chart...

Related

Forex Pair USDCAD Elliott Wave Forecast: Bearish Impulse Wave 3 Extends – Risk Levels, and Resistance Targets Identified

Forex Pair USDCAD Elliott Wave Forecast: Bearish Impulse Wave 3 Extends – Risk Levels, and Resistance Targets Identified

USDCAD shows a strong bearish Elliott Wave impulse on both daily and 4-hour charts. Wave 3 is in mot...

Read More >
DOW JONES - DJI Index Elliott Wave Technical Analysis: Understand how these waves impact Dow Jones trading strategies

DOW JONES - DJI Index Elliott Wave Technical Analysis: Understand how these waves impact Dow Jones trading strategies

This article provides a detailed Elliott Wave analysis for the Dow Jones (DJI) index, covering key m...

Read More >
Walmart Stock Analysis: Bullish Wave Setup in WMT Chart Signals Breakout Opportunity Using Elliott Wave Forecast Techniques

Walmart Stock Analysis: Bullish Wave Setup in WMT Chart Signals Breakout Opportunity Using Elliott Wave Forecast Techniques

Walmart stock shows potential bullish continuation as Elliott Wave analysis suggests wave {iv} may b...

Read More >
Texas Instruments Inc. Stock Analysis - TXN Elliott Wave Technical Analysis Shows key resistance levels and Stock Movements

Texas Instruments Inc. Stock Analysis - TXN Elliott Wave Technical Analysis Shows key resistance levels and Stock Movements

This analysis provides a detailed look at Texas Instruments Inc. (TXN) through the lens of Elliott W...

Read More >
U.S.Dollar/Japanese Yen(USDJPY) Forex Elliott Wave Technical Analysis: Impulsive Trends and Key Levels to Watch

U.S.Dollar/Japanese Yen(USDJPY) Forex Elliott Wave Technical Analysis: Impulsive Trends and Key Levels to Watch

Elliott Wave analysis of the USDJPY currency pair highlights the current trend, explains the impulsi...

Read More >
New Zealand Dollar/U.S.Dollar(NZDUSD) Forex Elliott Wave Technical Analysis: Detailed forecast based on current wave patterns.

New Zealand Dollar/U.S.Dollar(NZDUSD) Forex Elliott Wave Technical Analysis: Detailed forecast based on current wave patterns.

This article provides an in-depth Elliott Wave analysis of the NZDUSD pair, offering a detailed fore...

Read More >

$1 for 2 Weeks

then $29 a month!

What a Special Offer!

Trade Recommendations

Unleash the power of deversified trading with our comprehensive portfolio, covering 250+ markets:

  • Stock Trades
  • Crypto Trades
  • Forex Trades
  • Commodity Trades
Elliott Wave Analysis

Gain a competitive edge with expert insights and AI-powered Elliott Wave charting into:

  • Global Indices
  • US Stocks & ASX Stocks
  • Forex & Crypto
  • Commodities
Top-Notch Trading Tools

Equip yourself with the tools of success:

  • Real-time Chat rooms
  • Elliott Wave Algorithm
  • Portfolio tools
  • TradingLevels
  • Screener
  • Trading Game
7 Elliott Wave Analysts

Stay ahead of the market with daily charts and insightful videos
Your secret to strategic trading!

JOIN HERE


Welcome to TradingLounge (ASIC A.R.No. 321187), specialists in trades, trading education and technical analysis, covering stocks, indices, commodities, forex and cryptocurrencies.

When you join TradingLounge you have access to everything we offer, including trade tools, educational content and a social platform to chat with like-minded investors.

Read more

@Copyright 2024 by tradinglounge.com

Contact Us

Australian no: 02 4787 6020

International no: +61 (2) 47876020

Pay with:

Find us on