COST Elliott Wave Analysis Trading Lounge Daily Chart, 23 February 24

Welcome to our COST Elliott Wave Analysis Trading Lounge, your ultimate destination for comprehensive insights into Costco Wholesale Corp. (COST) using Elliott Wave Technical Analysis. As of the Daily Chart on 23rd February 2024, we delve into significant trends guiding the market.

COST Elliott Wave Technical Analysis

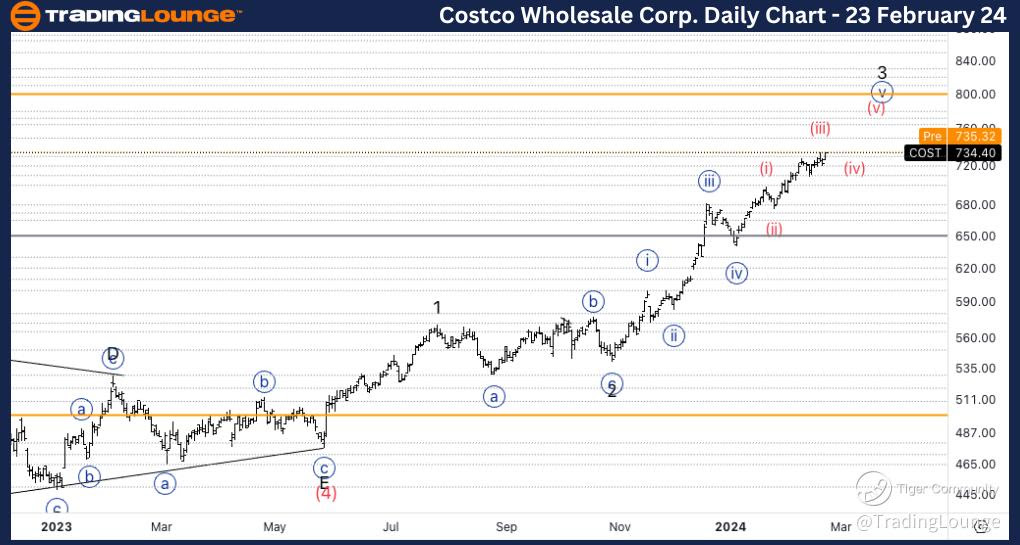
Costco Wholesale Corp., (COST) Daily Chart Analysis

FUNCTION: Trend  

MODE: Impulsive

STRUCTURE: Motive

POSITION: Minor wave 3 of (1).  

DIRECTION: Upside in wave {v} of 3.  

DETAILS: We are in between Medium Level 650$ and TL 800$ in what could be the end of a major Minor wave 3. Looking for continuation higher towards 800$, knowing the trend is starting to get weak as we are in the final stage of a wave {v}

In terms of wave dynamics, we identify a dominant impulse function with a motive structure. The current position is in Minor wave 3 of (1), indicating upside momentum in wave {v} of 3. As we hover between Medium Level $650 and TL $800, this could mark the potential end of a major Minor wave 3. We anticipate further continuation higher towards $800, although we recognize the weakening trend as we approach the final stage of wave {v}.
Costco-Wholesale-Day...


COST Elliott Wave Analysis Trading Lounge 4Hr Chart, 23 February 24

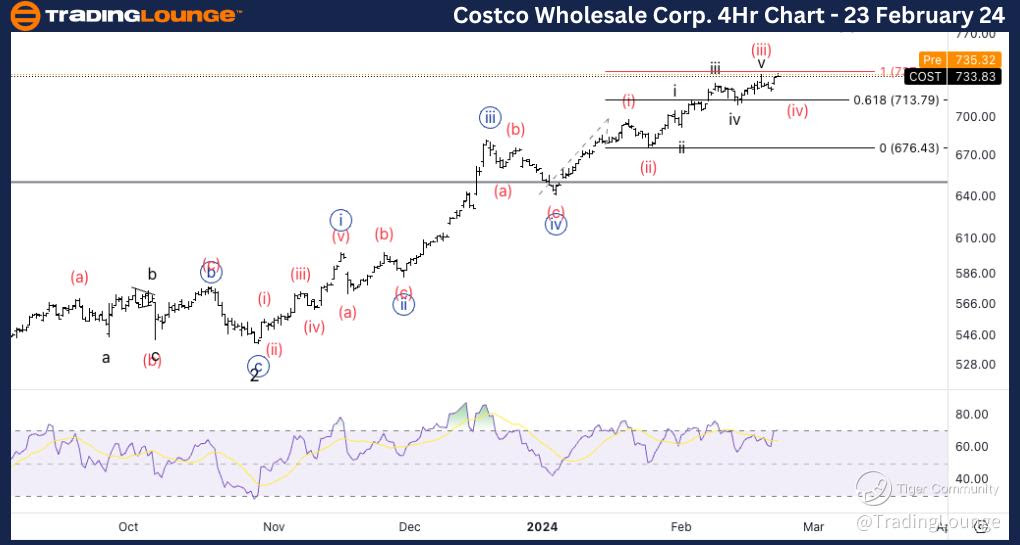
Costco Wholesale Corp., (COST) 4Hr Chart Analysis

COST Elliott Wave Technical Analysis – 4Hr Chart

FUNCTION: Trend

MODE: Impulsive

STRUCTURE: Motive

POSITION: Wave (v) of {iii}.

DIRECTION: Upside into wave {v}.

DETAILS: We are looking for either a wave (iv) in place or else a wave (iv) in the making, to then continue higher into wave (v). We can see RSI is showing signs of weakness which confirms the bias we are in the final stages of a trend.

Here, the wave function maintains its impulsive mode with a motive structure. The present position is in Wave (v) of {iii}, signaling further upside movement into wave {v}. We anticipate either a completed wave (iv) or the formations of wave (iv), followed by continued upward momentum into wave (v). Notably, the RSI shows signs of weakness, confirming our bias toward the final stages of the trend.

Technical Analyst: Alessio Barretta

Source: visit Tradinglounge.com and learn From the Experts Join TradingLounge Here 

See Previous: JP Morgan Chase & Co.(JPM)
Costco-Wholesale-4h-...

Related

Elliott Wave Analysis for KOSPI Trading: Stay Updated on the best KOSPI stocks, Daily Reports, and Essential Investment Tips

Elliott Wave Analysis for KOSPI Trading: Stay Updated on the best KOSPI stocks, Daily Reports, and Essential Investment Tips

This article provides a detailed Elliott Wave analysis of the KOSPI Composite Index, offering insigh...

Read More >
ITC Stock Elliott Wave Analysis: Forecasting Share Price Correction in Wave C and Strategic Trading Setup for FMCG Investors

ITC Stock Elliott Wave Analysis: Forecasting Share Price Correction in Wave C and Strategic Trading Setup for FMCG Investors

Get a full Elliott Wave analysis of ITC India, covering wave structures, correction phase, and price...

Read More >
Ripple (XRP) Crypto Price News Today and XRPUSD Elliott Wave Technical Analysis: XRP Price Forecast and Trading Strategy

Ripple (XRP) Crypto Price News Today and XRPUSD Elliott Wave Technical Analysis: XRP Price Forecast and Trading Strategy

XRPUSD is completing a Wave 2 A-B-C correction. Watch for bullish signals around $1.90–$1.88 to ent...

Read More >
Bitcoin/ U.S. Dollar (BTCUSD) Elliott Wave Analysis: Fibonacci Targets, Market Trends & Key Support Levels for Smart Investing

Bitcoin/ U.S. Dollar (BTCUSD) Elliott Wave Analysis: Fibonacci Targets, Market Trends & Key Support Levels for Smart Investing

BTCUSD Elliott Wave Analysis provides a technical breakdown of Bitcoin’s price movement, highlighti...

Read More >
JSW STEEL Indian Stocks Elliott Wave Technical Analysis Confirms Bullish Trend with Wave 3 and Key Support on Daily and Weekly Charts

JSW STEEL Indian Stocks Elliott Wave Technical Analysis Confirms Bullish Trend with Wave 3 and Key Support on Daily and Weekly Charts

The Elliott Wave analysis for JSW STEEL shows a bullish trend, with active impulsive waves on both d...

Read More >
The Home Depot (HD) Stocks Elliott Wave Technical Analysis: Focusing on its Bullish Momentum and Key Levels at $500 Target

The Home Depot (HD) Stocks Elliott Wave Technical Analysis: Focusing on its Bullish Momentum and Key Levels at $500 Target

This article provides an Elliott Wave analysis of The Home Depot (HD) stock, focusing on its bullish...

Read More >

$1 for 2 Weeks

then $29 a month!

What a Special Offer!

Trade Recommendations

Unleash the power of deversified trading with our comprehensive portfolio, covering 250+ markets:

  • Stock Trades
  • Crypto Trades
  • Forex Trades
  • Commodity Trades
Elliott Wave Analysis

Gain a competitive edge with expert insights and AI-powered Elliott Wave charting into:

  • Global Indices
  • US Stocks & ASX Stocks
  • Forex & Crypto
  • Commodities
Top-Notch Trading Tools

Equip yourself with the tools of success:

  • Real-time Chat rooms
  • Elliott Wave Algorithm
  • Portfolio tools
  • TradingLevels
  • Screener
  • Trading Game
7 Elliott Wave Analysts

Stay ahead of the market with daily charts and insightful videos
Your secret to strategic trading!

JOIN HERE


Welcome to TradingLounge (ASIC A.R.No. 321187), specialists in trades, trading education and technical analysis, covering stocks, indices, commodities, forex and cryptocurrencies.

When you join TradingLounge you have access to everything we offer, including trade tools, educational content and a social platform to chat with like-minded investors.

Read more

@Copyright 2024 by tradinglounge.com

Contact Us

Australian no: 02 4787 6020

International no: +61 (2) 47876020

Pay with:

Find us on