Wheat Commodity Elliott Wave Technical Analysis
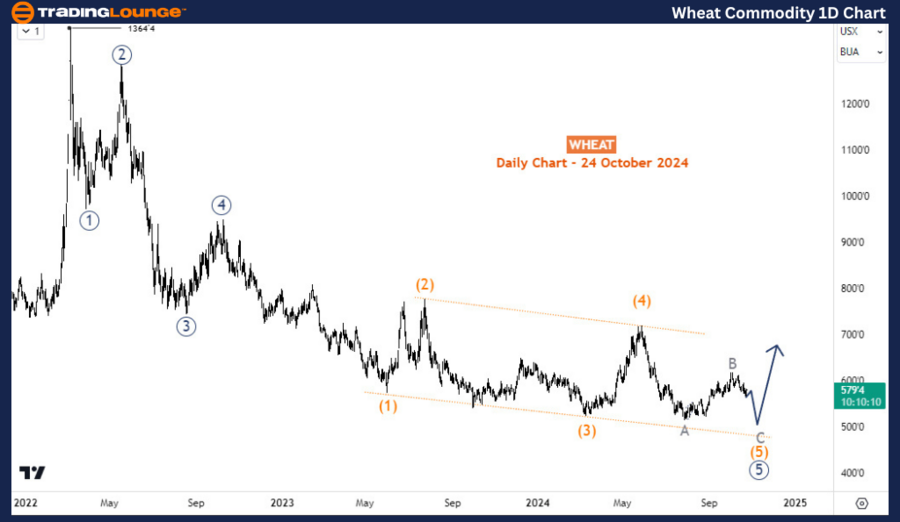
After a two-month rally in August and September 2024, wheat prices are experiencing another downturn as long-term sellers attempt to regain control. The long-term bearish trend that started in March 2022 may not have fully ended. Despite the recent price surge, traders should remain cautious, as a potential sell-off could be imminent in the coming weeks.
Wheat Commodity Daily Chart Analysis
The daily chart suggests that the bearish trend from March 2022 is nearing its final stages. The market structure appears to be forming an impulse wave, currently in its last leg, wave ((5)). Wave ((5)) likely completed a diagonal pattern in late July 2024. However, since the decline towards July resembles a 5-wave structure and the subsequent bounce appears corrective, another downward move, forming wave C of (5) of ((5)), seems highly probable.

Wheat Commodity H4 Chart Analysis
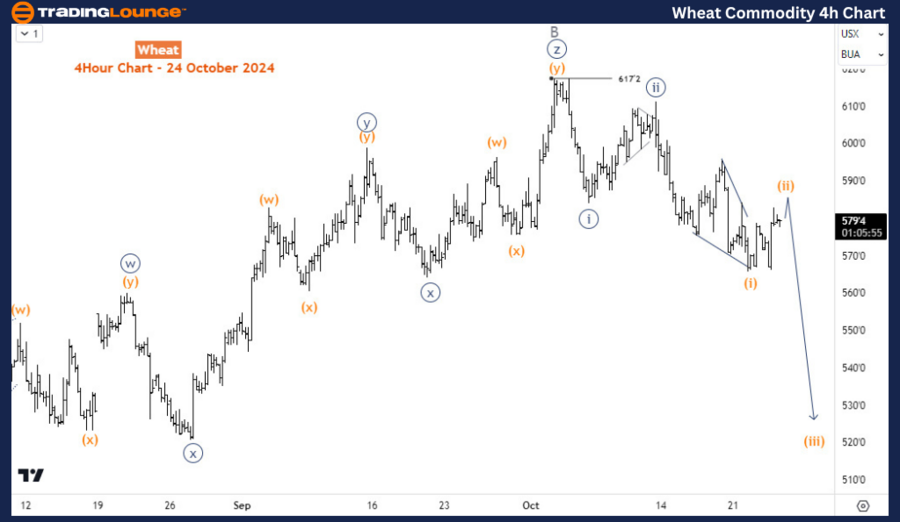
The H4 chart reveals that the response to the end of wave B is forming a ((i))-((ii))-(i)-(ii) structure. As long as the 11-October high remains unbroken and the price falls below the 22-October low, the decline from the 617 level is expected to continue into wave (iii) of ((iii)). Wave C of ((5)) is projected to dip below 500 in the coming weeks, with any upward bounces likely staying below the 617 level.
Technical Analyst: Sanmi Adeagbo
Source: visit Tradinglounge.com and learn From the Experts Join TradingLounge Here
See Previous: Cron Elliott Wave Technical Analysis
VALUE Offer - Buy 1 Month & Get 3 Months!Click here
Access 7 Analysts Over 200 Markets Covered. Chat Room With Support
