TradingLounge Forex Pair USD/JPY Elliott Wave Analysis: Day Chart
U.S. Dollar/Japanese Yen (USD/JPY) Day Chart
USD/JPY Elliott Wave Technical Analysis
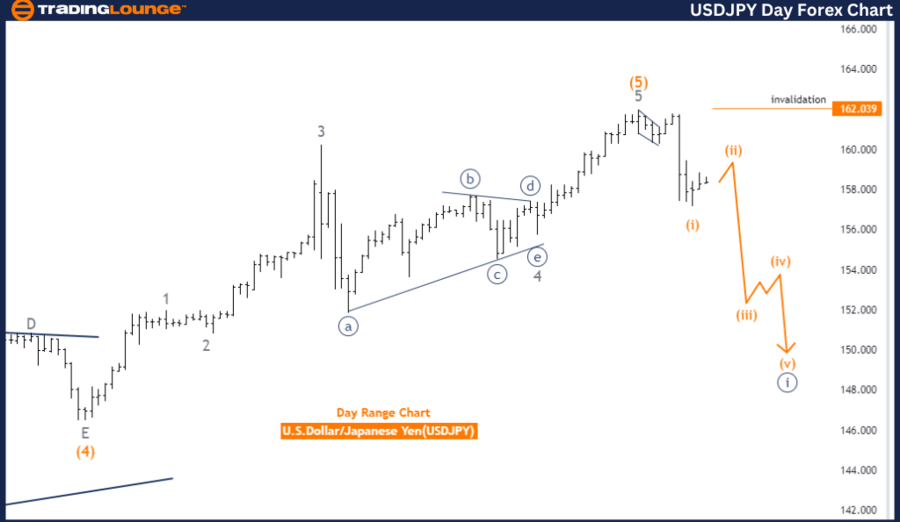
Function: Trend
Mode: Impulsive
Structure: Navy Blue Wave 1
Position: Gray Wave 1
Next Higher Degree Direction: Navy Blue Wave 2
Details: Navy Blue Wave 1 indicates a new downtrend.
Wave Cancel Invalid Level: 162.039
The USD/JPY Elliott Wave Analysis for the daily chart examines the current trend and wave patterns. This technical analysis identifies market movement as a trend function, suggesting the continuation of the current market direction.
The primary wave structure is Navy Blue Wave 1, marking the start of a new trend phase. This phase is impulsive, showing strong market movement. The market is positioned in Gray Wave 1 within the larger Navy Blue Wave 1 structure, indicating the early stages of this trend.
The next expected direction is Navy Blue Wave 2, which follows Navy Blue Wave 1's completion. This suggests that after the current trend phase, the market will enter a corrective phase marked by Navy Blue Wave 2, likely involving a pullback or consolidation before the trend continues.
A crucial detail is the wave cancel invalid level set at 162.039. This level is significant as it validates or invalidates the current wave count. If the market price exceeds this level, the current wave analysis would be invalid, requiring a reassessment of the market's condition. This invalidation level is essential for traders to manage risks and ensure the accuracy of the wave count.
Summary:
- The USD/JPY daily chart analysis identifies the market in an impulsive trend phase, specifically within Navy Blue Wave 1, positioned as Gray Wave 1.
- The analysis anticipates the next phase to be Navy Blue Wave 2, a corrective phase following the current trend.
- The wave cancellation invalid level at 162.039 is crucial for maintaining the validity of the current wave analysis and for effective risk management.
TradingLounge Forex Currency Pair USD/JPY Elliott Wave Analysis: 4-Hour Chart
U.S. Dollar/Japanese Yen (USD/JPY) 4-Hour Chart Analysis
USD/JPY Elliott Wave Technical Analysis
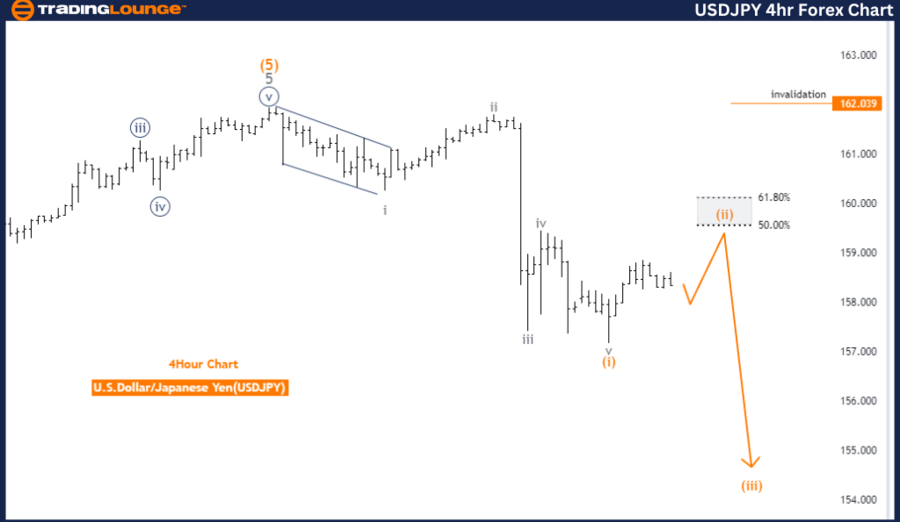
Function: Counter Trend
Mode: Corrective
Structure: Orange Wave 2
Position: Navy Blue Wave 1
Next Lower Degree Direction: Orange Wave 3
Details: Orange Wave 1 completed; Orange Wave 2 is in play.
Wave Cancel Invalid Level: 162.039
The USD/JPY Elliott Wave Analysis for the 4-hour chart identifies the current trends and wave patterns within the market. This technical analysis examines market movement in a counter trend function, indicating a corrective phase rather than a trend continuation.
The primary wave structure is Orange Wave 2, following the completion of Orange Wave 1. This means the market is currently experiencing a correction within the larger wave pattern. The analysis identifies Navy Blue Wave 1 as the position within this wave structure, suggesting the market is in the early stages of a new wave cycle.
The next expected direction is Orange Wave 3, following the current corrective phase of Orange Wave 2. This implies that once the corrective Wave 2 completes, the market will likely transition into Orange Wave 3, marking a new phase in the wave cycle.
A critical detail is the wave cancel invalid level set at 162.039. This level is significant as it validates or invalidates the current wave count. If the market price exceeds this level, the current wave analysis would be invalid, necessitating a reassessment of the market's condition. This invalidation level is essential for traders to manage risks and ensure the accuracy of the wave count.
Summary:
- The USD/JPY 4-hour chart analysis identifies the market in a counter trend corrective phase, specifically in Orange Wave 2 following the completion of Orange Wave 1.
- The analysis positions this within Navy Blue Wave 1 and anticipates the next move to be Orange Wave 3.
- The wave cancellation invalid level at 162.039 is a critical threshold for maintaining the validity of the current wave analysis and for effective risk management.\
Technical Analyst: Malik Awais
Source: visit Tradinglounge.com and learn From the Experts Join TradingLounge Here
Previous: EURUSD Elliott Wave Technical Analysis
Special Trial Offer - 0.76 Cents a Day for 3 Months! Click here
Access 7 Analysts Over 170 Markets Covered. Chat Room With Support