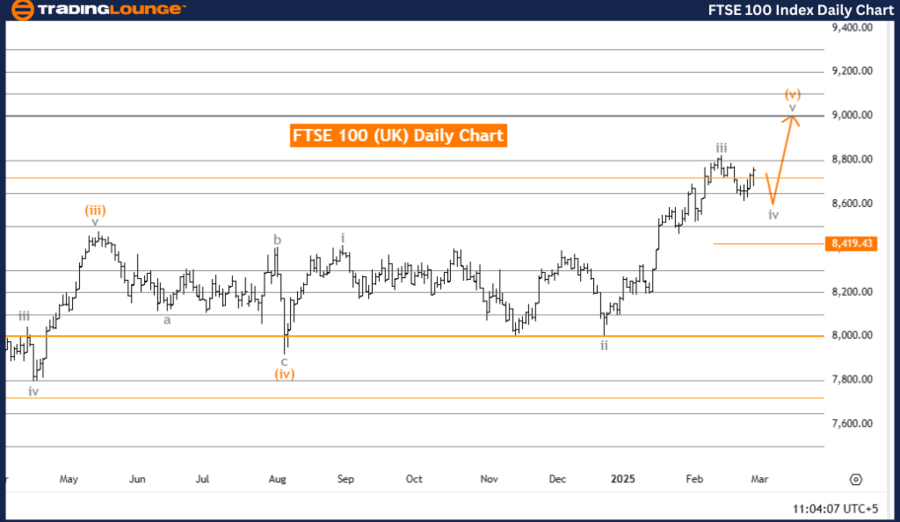
FTSE 100 (UK) Elliott Wave Analysis – Day Chart
FTSE 100 (UK) Elliott Wave Technical Analysis
Function: Counter Trend
Mode: Corrective
Structure: Orange Wave 5
Position: Navy Blue Wave 3
Direction Next Lower Degrees: Navy Blue Wave 4
Wave Cancel Invalid Level: 8,419.43
Market Overview
The FTSE 100 Elliott Wave Analysis for the daily chart indicates a counter-trend correction, with the market currently progressing in orange wave 5 within a broader corrective structure inside navy blue wave 3. This phase represents an intermediate correction before the market resumes its primary trend. The next expected move is navy blue wave 4, which should emerge after orange wave 5 is complete.
Wave Progression
- Orange wave 4 appears to have concluded, paving the way for orange wave 5 to develop.
- This corrective phase might involve sideways or upward price action before transitioning into navy blue wave 4.
- The completion of orange wave 5 is crucial, as it will likely confirm the start of navy blue wave 4, a potential impulsive move aligned with the broader market trend.
Key Level to Monitor
- Wave cancellation invalid level: 8,419.43
- A price movement above 8,419.43 will invalidate the current wave count, necessitating a market structure reassessment.
- This level serves as a key resistance zone, and a breakout beyond it may indicate a trend reversal.
Conclusion
The FTSE 100 remains in a corrective phase within its Elliott Wave structure, with orange wave 5 in play following the completion of orange wave 4. This movement is a part of navy blue wave 3, and the next major move is expected to be navy blue wave 4.
Traders should closely monitor the completion of orange wave 5, as it will provide critical insight into the timing and direction of the upcoming wave. Understanding Elliott Wave structures is essential for forecasting market movements and aligning trading strategies accordingly.
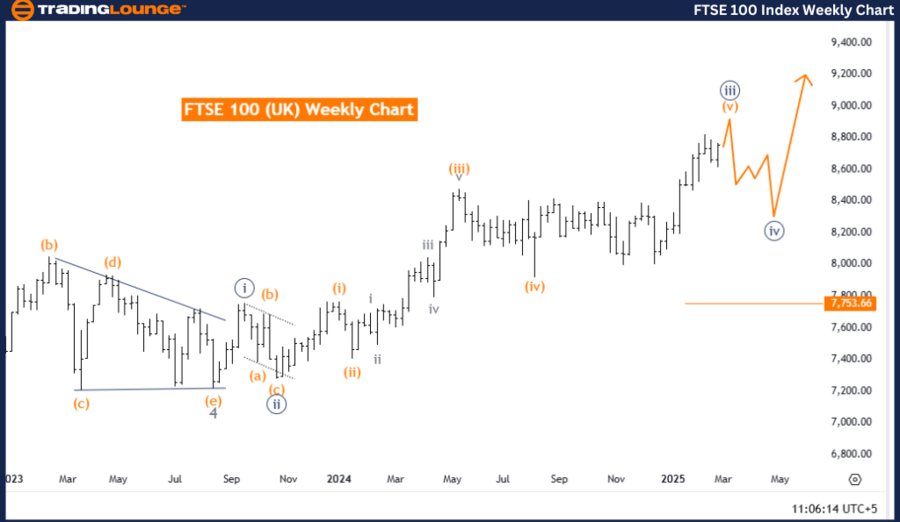
FTSE 100 (UK) Elliott Wave Analysis – Weekly Chart
FTSE 100 (UK) Elliott Wave Technical Analysis
Function: Bullish Trend
Mode: Impulsive
Structure: Navy Blue Wave 3
Position: Gray Wave 3
Direction Next Lower Degrees: Navy Blue Wave 4
Wave Cancel Invalid Level: 7,753.66
Market Overview
The FTSE 100 Elliott Wave Analysis for the weekly chart suggests a strong bullish trend, with the market currently experiencing an impulsive wave formation. The structure identifies navy blue wave 3, forming part of a larger upward trend within gray wave 3. This signifies sustained bullish momentum, characteristic of an impulsive wave formation. The next likely development is navy blue wave 4, introducing a corrective phase once navy blue wave 3 reaches completion.
Wave Progression
- Navy blue wave 2 appears finalized, allowing navy blue wave 3 to progress.
- Navy blue wave 3 is likely to maintain its strong upward momentum, consistent with an impulsive trend structure.
- Traders should carefully observe the progression of navy blue wave 3, as its completion may signal the beginning of navy blue wave 4, which could introduce temporary price pullbacks or market consolidation before the bullish trend resumes.
Key Level to Monitor
- Wave cancellation invalid level: 7,753.66
- A price movement below 7,753.66 will invalidate the current wave count, necessitating a re-evaluation of the market structure.
- This level functions as a key support zone, and a break beneath it may suggest a trend shift.
Conclusion
The FTSE 100 remains in a bullish phase, with navy blue wave 3 currently developing after the completion of navy blue wave 2. This impulsive movement is part of gray wave 3, with navy blue wave 4 expected to introduce a short-term corrective pullback before the upward trend resumes.
Traders should closely track price movements around the 7,753.66 support level, as it serves as a critical threshold in confirming the bullish outlook. Mastering Elliott Wave structures is key to anticipating market trends and refining trading strategies for optimal performance.
Technical Analyst: Malik Awais
Source: visit Tradinglounge.com and learn From the Experts Join TradingLounge Here
Previous: NIFTY 50 Elliott Wave Technical Analysis
VALUE Offer - Buy 1 Month & Get 3 Months!Click here
Access 7 Analysts Over 200 Markets Covered. Chat Room With Support