28Jan

Grasim Industries Stock Analysis: Indian Stocks Elliott Wave Technical Insights and Key Price Levels | Grasim stock Daily & 4H Chart

GRASIM INDUSTRIES – GRASIM Elliott Wave Analysis (1D Chart)

GRASIM 1D Chart Analysis

Grasim Industries Elliott Wave Technical Analysis

Function: Counter Trend Lower (Minor Degree Grey)

Mode: Corrective

Structure: Potential Zigzag or Impulse within Larger Degree Correction

Position: Minute Wave ((iii)) Navy

Details: A larger degree correction might be underway against the 2880 resistance level.

  • An interim low has been established near 2300 as the price pulls back.
  • Resistance is expected at the 2500–2600 range, providing a potential entry point for bearish momentum.

Invalidation Point: 2880

GRASIM Daily Chart Technical Analysis and Potential Elliott Wave Counts

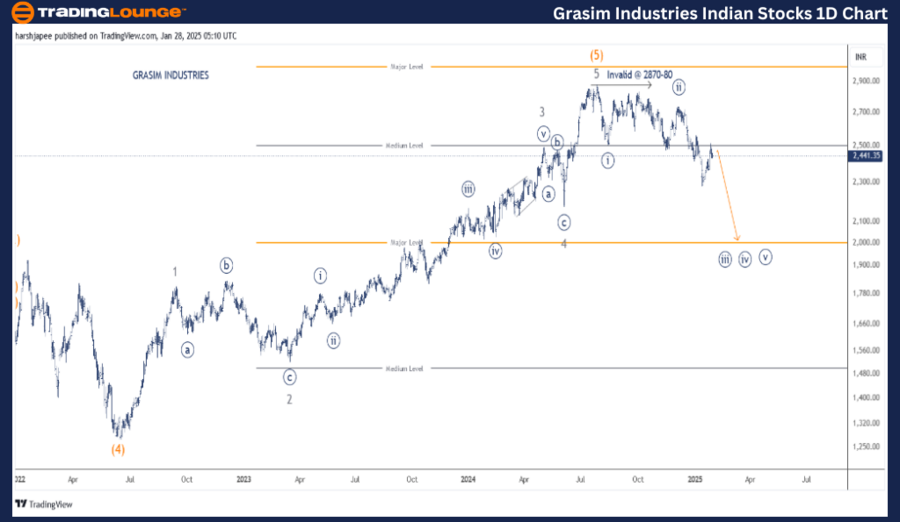
The daily chart of GRASIM suggests a significant top formed around 2880 in July 2024, completing Intermediate Wave (5) Orange. Following this, the stock appears to be moving lower in an impulse wave of Minute degree.

  • Wave ((i)) and Wave ((ii)) are identified near 2510 and 2740, respectively.
  • Currently, the stock seems to be in Minute Wave ((iii)), potentially an extension wave.

For bearish dominance:

  • Prices should remain below the 2740 resistance level.
  • Alternate Scenario: A corrective phase might have ended around 2275, allowing bulls to regain control.

Grasim-Industries-In...


GRASIM INDUSTRIES – GRASIM Elliott Wave Analysis (4H Chart)

Function: Counter Trend Lower (Minor Degree Grey)

Mode: Corrective

Structure: Potential Zigzag or Impulse within Larger Degree Correction

Position: Minute Wave ((iii)) Navy

Details: A larger degree correction could be forming against the 2880 resistance level.

  • An interim low was formed around 2300, with a price pullback underway.
  • Resistance near the 2500–2600 range remains a critical zone for bearish reentry.
  • Minute Wave ((iii)) is potentially progressing lower.

Invalidation Point: 2880

GRASIM 4H Chart Technical Analysis and Potential Elliott Wave Counts

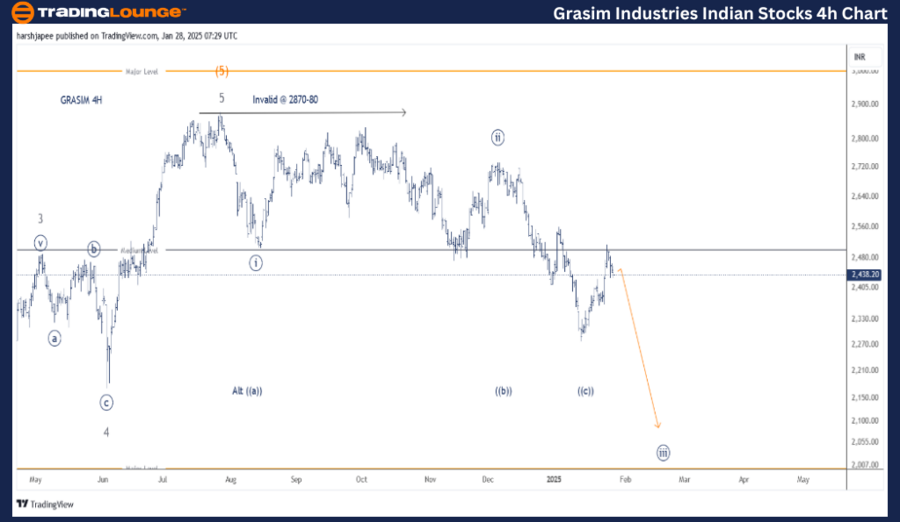
The 4H chart of GRASIM highlights subwaves within Minor Wave 3 Grey, which ended at 2487 in May 2024. Minor Wave 4 unfolded as a sharp zigzag, concluding around 2180 in June 2024. Wave 5 then surged to 2880, completing Intermediate Wave (5) Orange.

The subsequent price action:

  • A move towards 2275 formed in three waves, which could either develop as an impulse or an ((a))-((b))-((c)) correction.
  • Bears may push prices lower toward 2175, coinciding with Wave 4 of one lesser degree.

Technical Analyst: Harsh Japee

Source: visit Tradinglounge.com and learn From the Experts Join TradingLounge Here 

Previous: AXIS BANK LTD Elliott Wave Technical Analysis

VALUE Offer - Buy 1 Month & Get 3 Months!Click here

Access 7 Analysts Over 200 Markets Covered. Chat Room With Support

Grasim-Industries-In...


Conclusion

GRASIM is moving lower in Minute Wave ((iii)), targeting levels below 2175. Alternatively, a corrective decline may have concluded around 2275, opening opportunities for bullish momentum.

Related

Cocoa Commodity Elliott Wave Technical Analysis: The Current Correction Phase, and Trading Strategies for futures

Cocoa Commodity Elliott Wave Technical Analysis: The Current Correction Phase, and Trading Strategies for futures

Cocoa prices have been fluctuating since mid-May, with a potential for further declines. Using Ellio...

Read More >
Mastering Bitcoin Trading with Elliott Wave Analysis - Bitcoin/ U.S. dollar(BTCUSD) Technical Insights

Mastering Bitcoin Trading with Elliott Wave Analysis - Bitcoin/ U.S. dollar(BTCUSD) Technical Insights

Dive into the latest Bitcoin trading trends and Elliott Wave Technical Analysis for BTCUSD. Stay upd...

Read More >
Unlocking ASX Trading Success: V300AEQ ETF UNITS – VAS Stock Analysis & Elliott Wave Technical Forecast

Unlocking ASX Trading Success: V300AEQ ETF UNITS – VAS Stock Analysis & Elliott Wave Technical Forecast

This article provides an in-depth Elliott Wave technical analysis of the ASX VAS ETF Units, highligh...

Read More >
 NASDAQ Stock Market Report: AAPL, TSLA, AMZN, NVDA, MSFT, Meta Platforms, NFLX, GOOGL

NASDAQ Stock Market Report: AAPL, TSLA, AMZN, NVDA, MSFT, Meta Platforms, NFLX, GOOGL

NASDAQ-listed stocks, including AAPL, TSLA, AMZN, NVDA, MSFT, Meta Platforms, NFLX, and GOOGL. The a...

Read More >
Exploring the Dynamics of the GX Uranium ETF (URA) through - Commodities Elliottwave Technical analysis

Exploring the Dynamics of the GX Uranium ETF (URA) through - Commodities Elliottwave Technical analysis

This comprehensive analysis of the GX Uranium ETF (URA) offers a deep dive into its performance thro...

Read More >
Discover the Bullish Path of Coffee Commodity Prices, Key Targets, and Actionable Strategies: Coffee Elliott Wave Technical Analysis

Discover the Bullish Path of Coffee Commodity Prices, Key Targets, and Actionable Strategies: Coffee Elliott Wave Technical Analysis

This article provides an in-depth coffee Elliott wave analysis, covering price predictions, market t...

Read More >

Buy 1 Month

Get 3 Months!

Special Offer:

Trade Recommendations

Unleash the power of deversified trading with our comprehensive portfolio, covering:

  • Stock Trades
  • Crypto Trades
  • Forex Trades
  • Commodity Trades
Elliott Wave Analysis

Gain a competive edge with expert insights in to:

  • Global Indices
  • US Stocks & ASX Stocks
  • Forex & Crypto
  • Commodities
Top-Notch Trading Tools

Equip yourself with the tools of success:

  • Social Chat
  • Elliott Wave Algorithm
  • Screener
  • TradingLevels
  • Trading Game
7 Elliott Wave Analysts

Stay ahead of the market with daily charts and insightful videos
-Your secret to strategic trading!

JOIN HERE


Welcome to TradingLounge (ASIC A.R.No. 321187), specialists in trades, trading education and technical analysis, covering stocks, indices, commodities, forex and cryptocurrencies.

When you join TradingLounge you have access to everything we offer, including trade tools, educational content and a social platform to chat with like-minded investors.

Read more

@Copyright 2024 by tradinglounge.com

Contact Us

Australian no: 02 4787 6020

International no: +61 (2) 47876020

Pay with:

Find us on