27Feb

NIFTY 50 Elliott Wave Analysis: Market Forecast, Key Levels, Trading Strategy & Price Prediction Daily & 4H Chart Insights

NIFTY 50 INDEX (1D Chart) – Elliott Wave Technical Analysis

NIFTY 50 Wave Technical Analysis

Function: Counter Trend (Minor Degree, Grey)

Mode: Corrective

Structure: Zigzag

Position: Minute Wave ((c))

Invalidation Point: 26,400

Market Overview & Wave Count Analysis

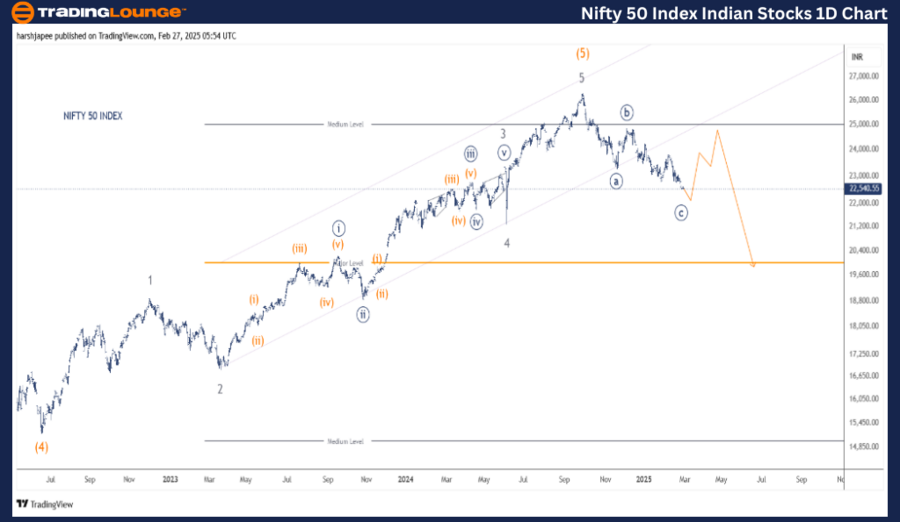
The alternate Elliott Wave count is currently the preferred outlook, indicating a potential ((a)) - ((b)) - ((c)) zigzag pattern nearing completion within the 22,500 - 22,550 zone. There is a strong probability of a counter-trend rally emerging from this level or possibly around 22,100.

NIFTY 50 INDEX Daily Chart – Elliott Wave Technical Analysis & Forecast

The NIFTY 50 Daily Chart suggests a major market top was formed around 26,300 in September 2024. The high-probability Elliott Wave count projects the following:

  • Minute Wave ((a)) / ((i)) completed near 23,267
  • Wave ((b)) / ((ii)) formed before Wave ((c)) / ((iii)), leading to a move toward 24,900 and the 22,500 - 22,550 range
  • The Intermediate Wave (4) Orange previously ended near 15,200, followed by a Minor degree impulse (Waves 1-5), which propelled prices to 26,300, marking the termination of Wave (5)

Market Outlook: Bullish or Bearish?

  • Bulls may attempt a rally toward the 24,700 range in the short term.
  • If the correction finalizes at the 22,400 mark, the likelihood of a return to 26,300 remains low.

NIFTY-50-1d-index-ch...


NIFTY 50 INDEX (4H Chart) – Elliott Wave Technical Analysis

Function: Counter Trend (Minor Degree, Grey)

Mode: Corrective

Structure: Zigzag

Position: Minute Wave ((c))

Invalidation Point: 26,400

Short-Term Market Insight & Key Levels

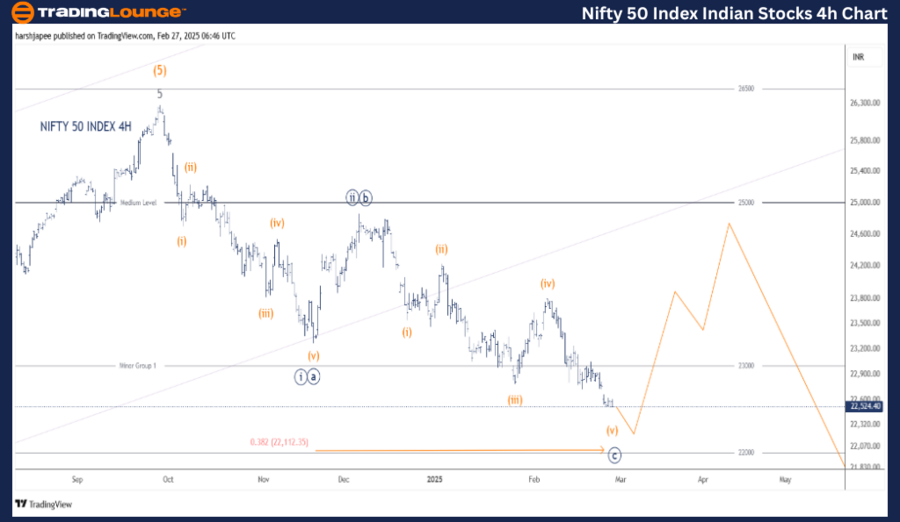
The alternate Elliott Wave count suggests that a ((a)) - ((b)) - ((c)) zigzag formation may be nearing completion around 22,500 - 22,550. A counter-trend rally remains likely from this level or closer to 22,100.

Alternatively, if NIFTY continues within Minute Wave ((iii)), the market may present a sell-on-rallies opportunity instead.

NIFTY 50 INDEX 4H Chart – Elliott Wave Counts & Price Forecast

The NIFTY 50 4H Chart tracks sub-wave movements from the 26,280 - 26,300 highs reached on September 27, 2024. Adjustments confirm a ((a)) - ((b)) - ((c)) zigzag completion from those peaks.

Alternate Wave Scenarios:

  • Minute Wave ((i)) - ((ii)) may be complete, with ((iii)) currently unfolding
  • The initial decline to 23,257 was labeled as Minute Wave ((a)) / ((i))
  • Followed by Wave ((b)) / ((ii)), reaching 24,900
  • Minute Wave ((c)) / ((iii)) is possibly nearing completion within 22,500 - 22,550

Potential Price Movements & Confirmation Signals

  • If the wave structure remains valid, a counter-trend rally to 24,400 - 24,500 could emerge
  • A breakout above 23,750 will confirm bulls have regained control, suggesting a potential move above 26,300

Technical Analyst: Harsh Japee

Source: visit Tradinglounge.com and learn From the Experts Join TradingLounge Here 

Previous: IBEX 35 (Spain) Elliott Wave Technical Analysis

VALUE Offer - Buy 1 Month & Get 3 Months!Click here

Access 7 Analysts Over 200 Markets Covered. Chat Room With Support

NIFTY-50-4h-index-ch...


Conclusion & Market Summary

The NIFTY 50 INDEX is currently trending downward toward the 22,000 - 22,100 zone, aligning with a larger corrective wave structure.

📢 Note: TradingLounge subscribers receive daily NIFTY 50 INDEX trade setup videos featuring Elliott Wave counts & technical analysis.

Related

The Coca-Cola Company (KO:NYSE) Elliott Wave Technical Analysis 8 January 24

The Coca-Cola Company (KO:NYSE) Elliott Wave Technical Analysis 8 January 24

The Coca-Cola Company (KO: NYSE) Elliott Wave Technical Analysis dated 8 January 24, KO Stock Market...

Read More >
Elliott Wave Trading Strategies: SP500, NASDAQ Tech Stocks & Key Earnings (April 2025)

Elliott Wave Trading Strategies: SP500, NASDAQ Tech Stocks & Key Earnings (April 2025)

Stay ahead in the markets with our detailed Elliott Wave analysis. This post delivers expert insight...

Read More >
XRPUSD Elliott Wave Technical Analysis: XRP Price Prediction, Trading Strategy, and Technical Indicators

XRPUSD Elliott Wave Technical Analysis: XRP Price Prediction, Trading Strategy, and Technical Indicators

This article provides a comprehensive XRPUSD Elliott Wave analysis, highlighting the price predictio...

Read More >
XOM Elliott Wave Analysis: Technical Insights on Exxon Mobil Corp. - 5 February 24

XOM Elliott Wave Analysis: Technical Insights on Exxon Mobil Corp. - 5 February 24

This Elliott Wave analysis of Exxon Mobil Corp. (XOM) on both daily and 4-hour charts provides valua...

Read More >
ASX: CAR GROUP LIMITED – CAR Stock Analysis & Elliott Wave Technical Analysis Suggests Wave Correction Completes

ASX: CAR GROUP LIMITED – CAR Stock Analysis & Elliott Wave Technical Analysis Suggests Wave Correction Completes

CAR Group (ASX: CAR) shows signs of completing a wave (4) correction, setting up for a bullish wave ...

Read More >
CAC 40 Elliott Wave Forecast with Daily and Weekly Chart Analysis Highlighting Corrective Wave Structure and France Stock Market

CAC 40 Elliott Wave Forecast with Daily and Weekly Chart Analysis Highlighting Corrective Wave Structure and France Stock Market

Accurate Elliott Wave forecast for the CAC 40 index with detailed daily and weekly chart analysis. U...

Read More >

$1 for 2 Weeks

then $29 a month!

What a Special Offer!

Trade Recommendations

Unleash the power of deversified trading with our comprehensive portfolio, covering 250+ markets:

  • Stock Trades
  • Crypto Trades
  • Forex Trades
  • Commodity Trades
Elliott Wave Analysis

Gain a competitive edge with expert insights and AI-powered Elliott Wave charting into:

  • Global Indices
  • US Stocks & ASX Stocks
  • Forex & Crypto
  • Commodities
Top-Notch Trading Tools

Equip yourself with the tools of success:

  • Real-time Chat rooms
  • Elliott Wave Algorithm
  • Portfolio tools
  • TradingLevels
  • Screener
  • Trading Game
7 Elliott Wave Analysts

Stay ahead of the market with daily charts and insightful videos
Your secret to strategic trading!

JOIN HERE


Welcome to TradingLounge (ASIC A.R.No. 321187), specialists in trades, trading education and technical analysis, covering stocks, indices, commodities, forex and cryptocurrencies.

When you join TradingLounge you have access to everything we offer, including trade tools, educational content and a social platform to chat with like-minded investors.

Read more

@Copyright 2024 by tradinglounge.com

Contact Us

Australian no: 02 4787 6020

International no: +61 (2) 47876020

Pay with:

Find us on