25Apr

VanEck Rare Earth & Strategic Metals ETF – REMX Elliott Wave Analysis Shows Wave 4 Rally Toward $57 Before Final Decline in Bearish Wave 5

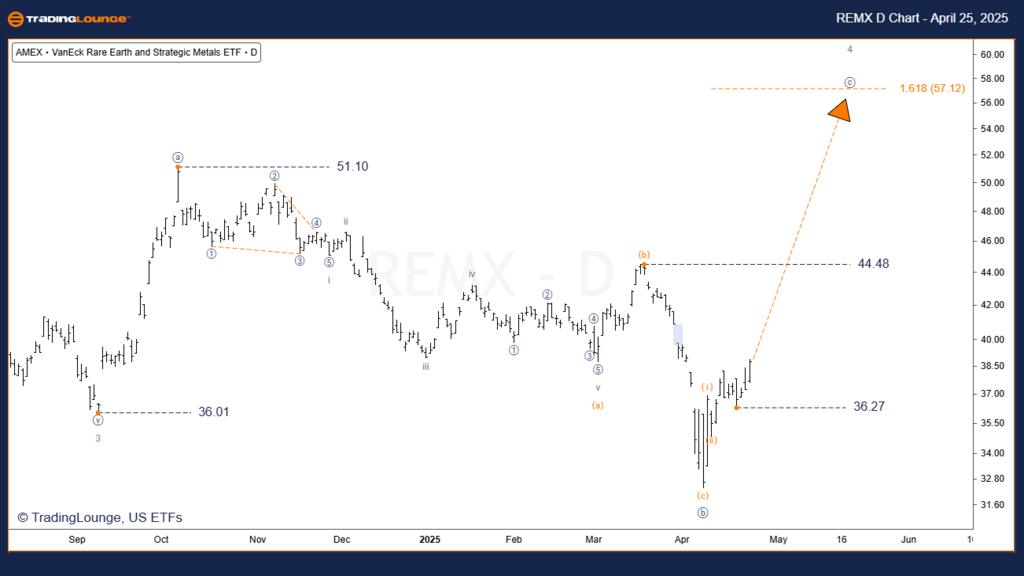
VanEck Rare Earth & Strategic Metals ETF – REMX (1D) Elliott Wave Technical Analysis Daily Chart

REMX Elliott Wave Technical Analysis

Function: Counter-Trend

Mode: Corrective

Structure: Expanded Flat

Position: Wave [c] of 4

Direction: Bear Market Rally

Details:

Wave 4 of the VanEck Rare Earth & Strategic Metals ETF (REMX) is progressing through its final subwave phase before completing the overall correction.

The current bear market rally is expected to retrace between 38.2% and 50% of the preceding wave 3 decline, aligning with classic Elliott Wave corrective behavior.

Confirmation of the expanded flat corrective structure will be achieved if price action surpasses the key resistance level at $51.10.

The projected termination zone for wave 4 stands near the $57.12 price level.

Upon completion of wave 4, a bearish wave 5 decline is forecasted, likely targeting levels below the origin of wave 4.

Invalidation Level: $32.36

REMX-ETF-day-chart-2...


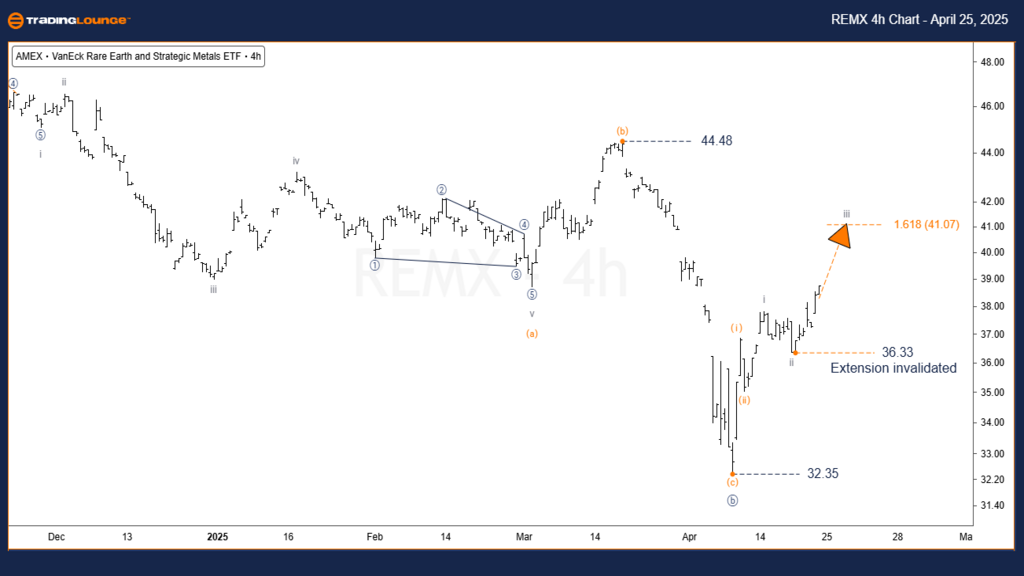
VanEck Rare Earth & Strategic Metals ETF – REMX (4H) Elliott Wave Technical Analysis Hourly Chart

REMX Elliott Wave Technical Analysis

Function: Major Trend (Minor Degree, Grey)

Mode: Motive

Structure: Impulse

Position: Wave [c] Navy of 4 Grey

Direction: Rally

Details:

The ongoing rally in the VanEck Rare Earth & Strategic Metals ETF (REMX) should continue with impulsive momentum, aiming to break above the crucial $51.10 resistance.

Wave [c] is anticipated to push strongly toward the previous wave [a] high, confirming the bullish impulse structure within wave 4.

This rally represents the final leg of the corrective wave 4 phase.

There is a possibility of an extended wave pattern, with further advancement into wave iii of (iii).

Critical support that must hold for the bullish scenario remains at $36.33.

Invalidation Level: $36.33

Technical Analyst: Simon Brooks

Source: Visit Tradinglounge.com and learn from the Experts. Join TradingLounge Here 

See Previous:  SPDR Select Sector Fund ETF – XLF Elliott Wave Technical Analysis

VALUE Offer - Buy 1 Month & Get 3 Months!Click here

Access 7 Analysts Over 200 Markets Covered. Chat Room With Support

REMX-ETF-4h-chart-25...

Related

GBPAUD Elliott Wave Analysis: Bearish Trend Unfolding with Key Price Levels and Trading Insights for Forex Traders

GBPAUD Elliott Wave Analysis: Bearish Trend Unfolding with Key Price Levels and Trading Insights for Forex Traders

This comprehensive GBPAUD Elliott Wave analysis provides insight into the current bearish trend, exa...

Read More >
Unlocking Profit Potential with Elliott Wave Analysis for Binance Coin (BNBUSD) Trading - 13th February 2024

Unlocking Profit Potential with Elliott Wave Analysis for Binance Coin (BNBUSD) Trading - 13th February 2024

The February 13, 2024, Binance Coin (BNBUSD) Elliott Wave Analysis, explores cryptocurrency market t...

Read More >
JSW Steel Elliott Wave Forecast Shows Bullish Wave 2 Correction and Ideal Buy Signal for Upcoming Wave 3 Surge

JSW Steel Elliott Wave Forecast Shows Bullish Wave 2 Correction and Ideal Buy Signal for Upcoming Wave 3 Surge

JSW Steel shows a bullish Elliott Wave setup with wave 2 correction unfolding. Ideal entry points ar...

Read More >
BLOCK, INC - XYZ (SQ2) Elliott Wave Analysis: Wave 2 Nears 80.00 AUD Support Zone with a Bullish Wave Forecast

BLOCK, INC - XYZ (SQ2) Elliott Wave Analysis: Wave 2 Nears 80.00 AUD Support Zone with a Bullish Wave Forecast

This analysis covers Elliott Wave patterns for ASX: BLOCK INC (SQ2), targeting the 80.00 AUD support...

Read More >
Technical Analysis of GX Uranium: GX Uranium Commodity Elliott Wave Analysis

Technical Analysis of GX Uranium: GX Uranium Commodity Elliott Wave Analysis

In an ever-evolving uranium market, the GX Uranium ETF (URA) stands out as a pivotal investment oppo...

Read More >
NVIDIA Corp.(NVDA) Stock Elliott Wave Technical Analysis : Market analysis shows NVDA Stock performance.

NVIDIA Corp.(NVDA) Stock Elliott Wave Technical Analysis : Market analysis shows NVDA Stock performance.

This detailed analysis leverages the Elliott Wave Theory to provide a deep dive into NVIDIA Corporat...

Read More >

$1 for 2 Weeks

then $29 a month!

What a Special Offer!

Trade Recommendations

Unleash the power of deversified trading with our comprehensive portfolio, covering 250+ markets:

  • Stock Trades
  • Crypto Trades
  • Forex Trades
  • Commodity Trades
Elliott Wave Analysis

Gain a competitive edge with expert insights and AI-powered Elliott Wave charting into:

  • Global Indices
  • US Stocks & ASX Stocks
  • Forex & Crypto
  • Commodities
Top-Notch Trading Tools

Equip yourself with the tools of success:

  • Real-time Chat rooms
  • Elliott Wave Algorithm
  • Portfolio tools
  • TradingLevels
  • Screener
  • Trading Game
7 Elliott Wave Analysts

Stay ahead of the market with daily charts and insightful videos
Your secret to strategic trading!

JOIN HERE


Welcome to TradingLounge (ASIC A.R.No. 321187), specialists in trades, trading education and technical analysis, covering stocks, indices, commodities, forex and cryptocurrencies.

When you join TradingLounge you have access to everything we offer, including trade tools, educational content and a social platform to chat with like-minded investors.

Read more

@Copyright 2024 by tradinglounge.com

Contact Us

Australian no: 02 4787 6020

International no: +61 (2) 47876020

Pay with:

Find us on