Apple Inc. (AAPL) Elliott Wave Analysis – Trading Lounge Daily Chart
AAPL Elliott Wave Technical Analysis
Function: Countertrend
Mode: Corrective
Structure: Flat
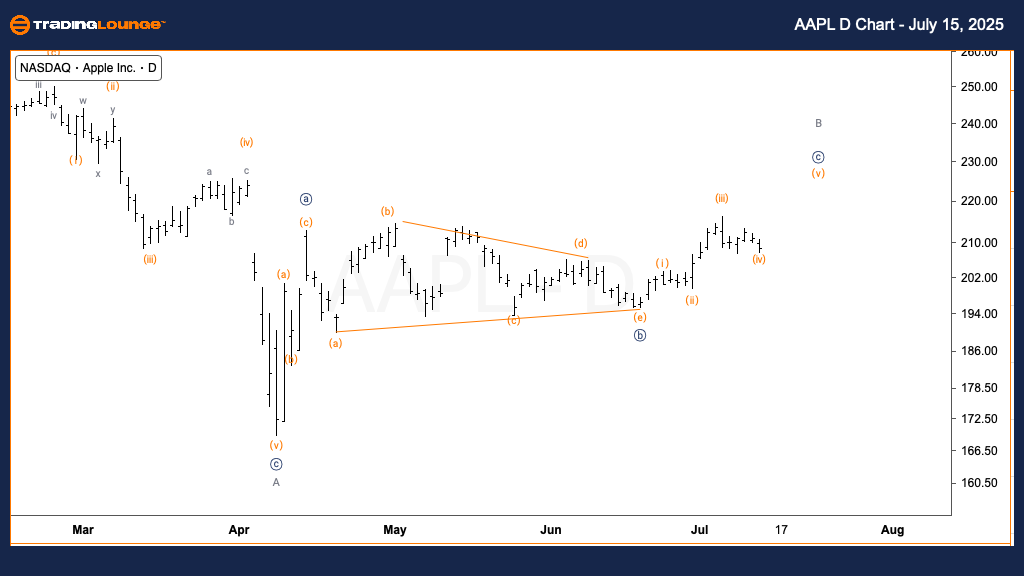
Position: Wave {c} of B
Direction: Upside in {c}
Details: Anticipating further upside within wave {c}, with crucial Fibonacci targets at $224 (0.618 projection) and $244 (wave {a} equality level).
Apple Inc. (NASDAQ: AAPL) is currently exhibiting a corrective pattern on its daily chart, identified as wave {c} of B in a flat structure. The Elliott Wave count suggests that the move remains countertrend. Fibonacci extension levels suggest resistance near $224 and $244, aligning with 0.618 and 1.000 projections of wave {a}. The short-term bullish momentum remains intact until this corrective phase concludes, after which the dominant trend may resume.
Apple Inc. (AAPL) Elliott Wave Analysis – Trading Lounge 1-Hour Chart
AAPL Elliott Wave Technical Analysis
Function: Countertrend
Mode: Corrective
Structure: Flat
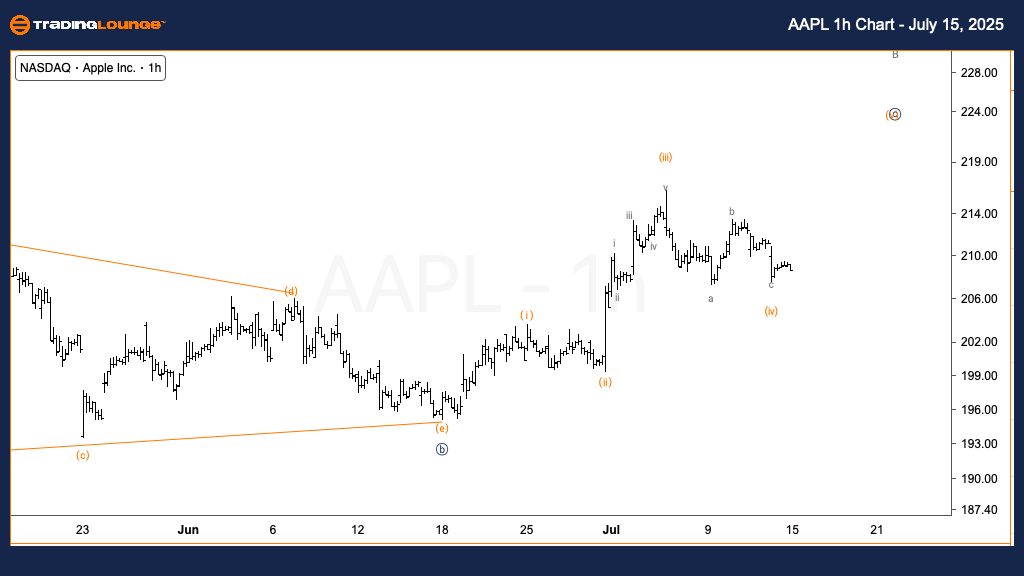
Position: Wave (iv) of {c}
Direction: Upside in {c}
Details: Wave (iv) appears to have completed a three-wave correction. A rise in wave (v) of {c} is now expected. Since wave (iii) was longer than wave (i), wave (v) may extend further.
The 1-hour timeframe of AAPL suggests that wave (iv) of {c} has likely ended after a well-formed three-wave decline. This sets the stage for an upward move in wave (v) of {c}. Given that wave (iii) surpassed wave (i), there is a strong possibility that wave (v) may extend. This supports a bullish near-term outlook with focus on the $224 to $244 target range as wave {c} completes.
Technical Analyst: Alessio Barretta
Visit: TradingLounge.com for detailed analysis and market updates.
Previous: Walmart Inc. (WMT) Elliott Wave Technical Analysis
VALUE Offer - Buy 1 Month & Get 3 Months!Click here
Access 7 Analysts Over 200 Markets Covered. Chat Room With Support