CRM Elliott Wave Analysis for Salesforce Inc. (CRM)

This analysis delves into the current trend structure of Salesforce Inc. (CRM) by applying the Elliott Wave Theory across both daily and 1-hour charts. Below is an overview of the stock's current position and its potential future trajectory.

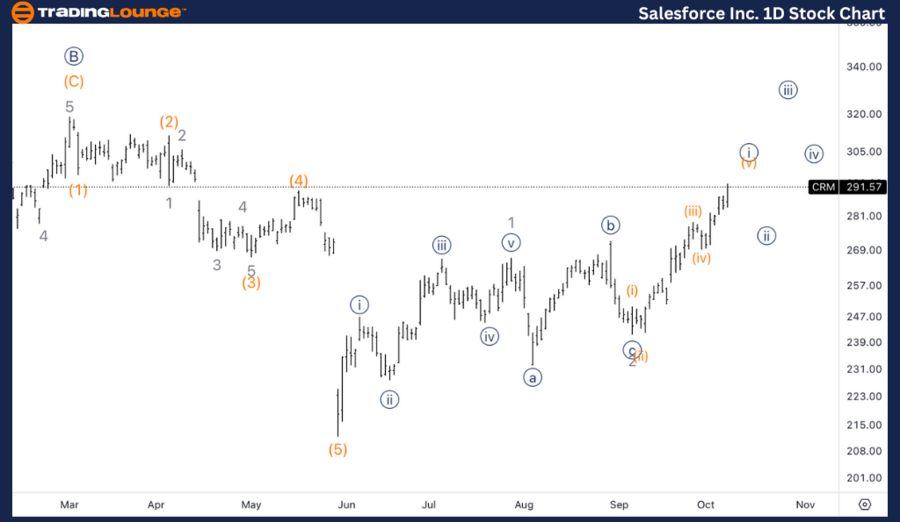
CRM Elliott Wave Analysis - TradingLounge Daily Chart

Salesforce Inc. (CRM) Daily Chart Overview

CRM Elliott Wave Technical Analysis

Function: Trend

Mode: Impulsive

Structure: Motive

Position: Minor 3

Direction: Upside within 3

Details: As the correction in Primary wave 4 might still be incomplete, the possibility of a running flat in wave 4 is being considered. This suggests that Salesforce could be in the early stages of a potential bull market.

CRM Daily Chart Analysis: CRM Elliott Wave Outlook

On the daily chart, Salesforce (CRM) is currently in the third wave (Minor wave 3) of an impulsive structure. Analysts are evaluating whether a Primary wave 4 correction is still unfolding. This points toward a potential running flat correction in wave 4, indicating that CRM might be in the early stages of a new bull market. If this scenario holds true, the stock could see higher trends once the correction phase is completed.

Salesforce-Inc-1D-St...


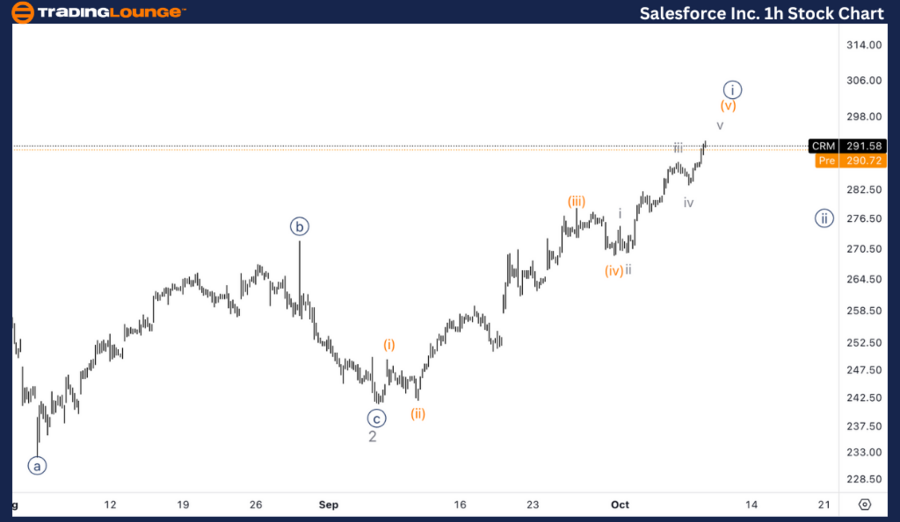
Salesforce Inc Elliott Wave Analysis - TradingLounge 1-Hour Chart

Salesforce Inc. (CRM) 1-Hour Chart Overview

CRM Elliott Wave Technical Analysis

Function: Trend

Mode: Impulsive

Structure: Motive

Position: Wave {i} of 3

Direction: Top in wave {i}

Details: A top in wave {i} of 3 could soon form, as a well-defined subdivision is visible. However, it's possible that this move is part of wave C, and the broader correction may still continue.

1-Hour Chart Analysis: CRM Elliott Wave Outlook

On the 1-hour chart, Salesforce is approaching a potential top in wave {i} of 3, with clear subdivisions evident in the wave structure. Alternatively, this movement could belong to wave C, suggesting that the larger corrective phase may not be over yet. How this current wave develops will determine whether the correction has ended or if further downside is anticipated before the stock resumes its upward trend.

Technical Analyst: Alessio Barretta

Source: visit Tradinglounge.com and learn From the Experts Join TradingLounge Here 

See Previous: The Coca-Cola Company (KO) Elliott Wave Technical Analysis

VALUE Offer - Buy 1 Month & Get 3 Months!Click here

Access 7 Analysts Over 200 Markets Covered. Chat Room With Support

Salesforce-Inc-1h-St...

Related

WTI Crudeoil Commodity Elliott Wave Technical Analysis: Highlights Significant Support and Resistance levels to watch

WTI Crudeoil Commodity Elliott Wave Technical Analysis: Highlights Significant Support and Resistance levels to watch

This article provides an in-depth Elliott Wave analysis of WTI crude oil, focusing on its bearish cy...

Read More >
Exxon Mobil Inc. Stocks Elliott Wave Technical Analysis: Focusing XOM Stcok Market Behavior with chart Analysis

Exxon Mobil Inc. Stocks Elliott Wave Technical Analysis: Focusing XOM Stcok Market Behavior with chart Analysis

Discover our latest Elliott Wave analysis for Exxon Mobil Inc. (XOM) as of June 10, 2024. This compr...

Read More >
British Pound / Japanese Yen Forex Elliott Wave Technical Analysis: Shows Impulsive Bullish Structure Suggesting More Gains

British Pound / Japanese Yen Forex Elliott Wave Technical Analysis: Shows Impulsive Bullish Structure Suggesting More Gains

This analysis highlights GBPJPY’s current bullish phase within Elliott Wave structure, forecasting ...

Read More >
Technical Breakdown Provides THETAUSD Elliott Wave Forecast: Offering Fibonacci Targets, Trade Strategies, and Invalidation Levels

Technical Breakdown Provides THETAUSD Elliott Wave Forecast: Offering Fibonacci Targets, Trade Strategies, and Invalidation Levels

This technical breakdown provides Elliott Wave analysis for THETAUSD, offering Fibonacci targets, tr...

Read More >
Computershare (ASX: CPU) Elliott Wave Forecast Highlights Bullish Wave (v) Breakout with Key Price Targets and Support Levels

Computershare (ASX: CPU) Elliott Wave Forecast Highlights Bullish Wave (v) Breakout with Key Price Targets and Support Levels

ASX: CPU may have completed wave (IV) and started wave (V) with bullish potential. See key levels an...

Read More >
Dow Jones Elliott (DJI) Wave Analysis Reveals Bullish Wave 1 Structure with Market Trend Insights and Forecast for Stock Traders

Dow Jones Elliott (DJI) Wave Analysis Reveals Bullish Wave 1 Structure with Market Trend Insights and Forecast for Stock Traders

This Elliott Wave analysis for the Dow Jones Industrial Average highlights a bullish market trend ba...

Read More >

$1 for 2 Weeks

then $29 a month!

What a Special Offer!

Trade Recommendations

Unleash the power of deversified trading with our comprehensive portfolio, covering 250+ markets:

  • Stock Trades
  • Crypto Trades
  • Forex Trades
  • Commodity Trades
Elliott Wave Analysis

Gain a competitive edge with expert insights and AI-powered Elliott Wave charting into:

  • Global Indices
  • US Stocks & ASX Stocks
  • Forex & Crypto
  • Commodities
Top-Notch Trading Tools

Equip yourself with the tools of success:

  • Real-time Chat rooms
  • Elliott Wave Algorithm
  • Portfolio tools
  • TradingLevels
  • Screener
  • Trading Game
7 Elliott Wave Analysts

Stay ahead of the market with daily charts and insightful videos
Your secret to strategic trading!

JOIN HERE


Welcome to TradingLounge (ASIC A.R.No. 321187), specialists in trades, trading education and technical analysis, covering stocks, indices, commodities, forex and cryptocurrencies.

When you join TradingLounge you have access to everything we offer, including trade tools, educational content and a social platform to chat with like-minded investors.

Read more

@Copyright 2024 by tradinglounge.com

Contact Us

Australian no: 02 4787 6020

International no: +61 (2) 47876020

Pay with:

Find us on