TradingLounge Coffee Commodity Elliott Wave Analysis
Function: Counter-Trend
Mode: Correction
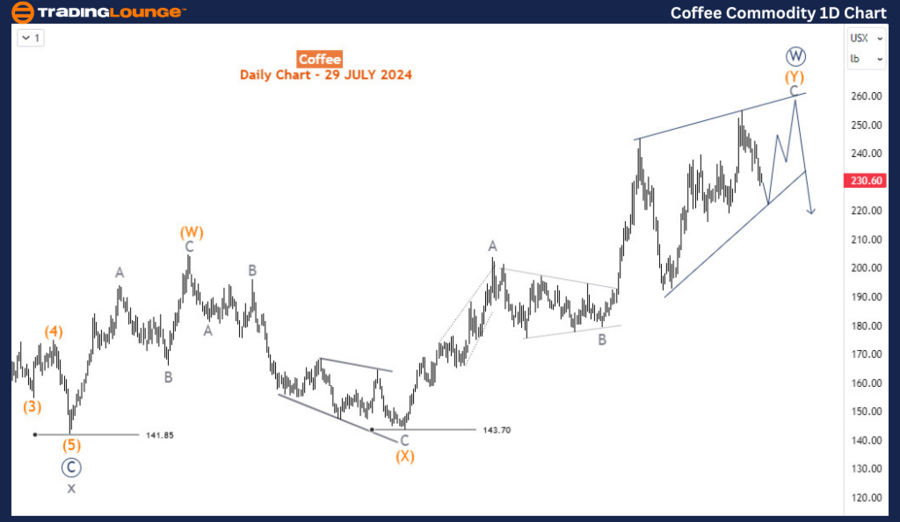
Structure: Double zigzag for wave W (circled)
Position: Wave (Y) of W
Direction: Wave (Y) of W is still in progress
Details: The commodity still favors the upside to complete wave C of (W) before turning downside in wave X (circled) pullback.
Coffee Elliott Wave Technical Analysis
Coffee is currently in a retracement phase after reaching a fresh peak for 2024. The commodity has been on a strong bullish run since January 2023, following an 11-month pullback that began in February 2022. In the near to medium term, Coffee is likely to hit another high before undergoing a more substantial pullback.
Long-Term Chart Analysis
Coffee has historically exhibited range-bound movements. The lower boundary ranges between $40 and $55, while the upper boundary ranges between $276 and $337. The current bullish phase began in May 2019 and completed its first phase in February 2022. The second phase, a pullback from the February 2022 peak, concluded in January 2023. The third and current bullish phase started in January 2023 and is expected to evolve in a corrective structure.
Daily Chart Analysis
On the daily chart, the third phase of the recovery completed its first leg, wave (W), in April 2023 before transitioning into another 3-wave structure for wave (X), which ended at 143.70 in October 2023. The current surge is anticipated to complete wave (Y) of the primary degree wave W (circled). Following this, a larger pullback for wave X (circled) is expected. Currently, wave (Y) is still in progress, with price in wave C of (Y), which is forming an ending diagonal structure.

Coffee H4 Chart Analysis
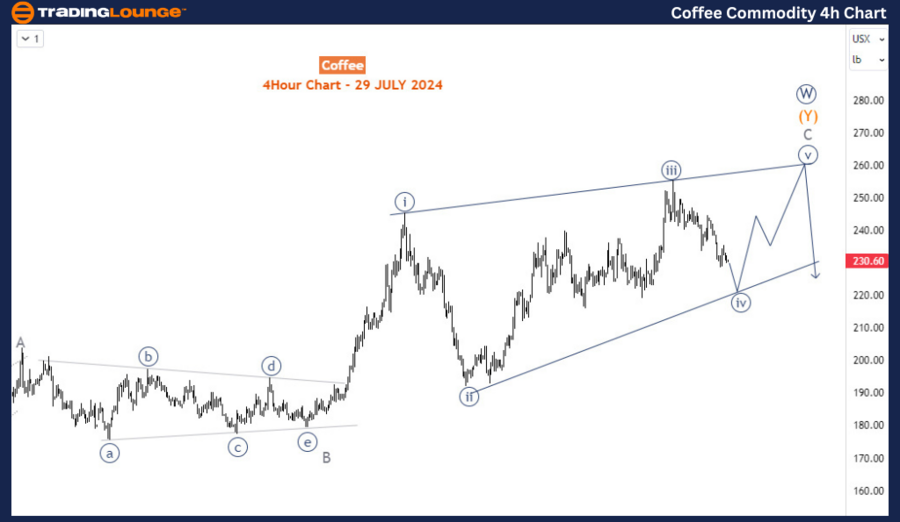
On the H4 chart, the ending diagonal for wave C is in its fourth wave, wave iv (circled). One more rally is anticipated to complete wave v (circled) within the diagonal. After this rally, a significant pullback is expected to occur, forming another corrective structure.
Summary
The Elliott Wave analysis for Coffee suggests that after the current retracement, the commodity is likely to see another high before a more substantial pullback ensues. Key levels to watch include the completion of wave v (circled) on the H4 chart and the subsequent larger pullback.
Technical Analyst: Sanmi Adeagbo
Source: visit Tradinglounge.com and learn From the Experts Join TradingLounge Here
See Previous: Corn Elliott Wave Technical Analysis
Special Trial Offer - 0.76 Cents a Day for 3 Months! Click here
Access 7 Analysts Over 170 Markets Covered. Chat Room With Support
