16Feb

Price Action Wheat Elliott Wave Analysis: Technical insights, forecasts, and trading opportunitie

Wheat Elliott Wave Technical Analysis 16 February 24

Wheat price chart analysis

Daily and 4-hour timeframe

Function - Counter-trend

Mode - Corrective

Structure - Triangle

Position - Black Wave X of red wave (5)

Direction - Black Wave Y of red wave (5)

The price action of wheat is quite interesting. It's fascinating to see how the Elliott wave theory can be applied to price charts, and wheat is a perfect example of that. After being stuck in a sideways trend for over a month, the commodity broke out to the downside. This has increased confidence that the Bears will continue to dominate in the coming days or the next few weeks.

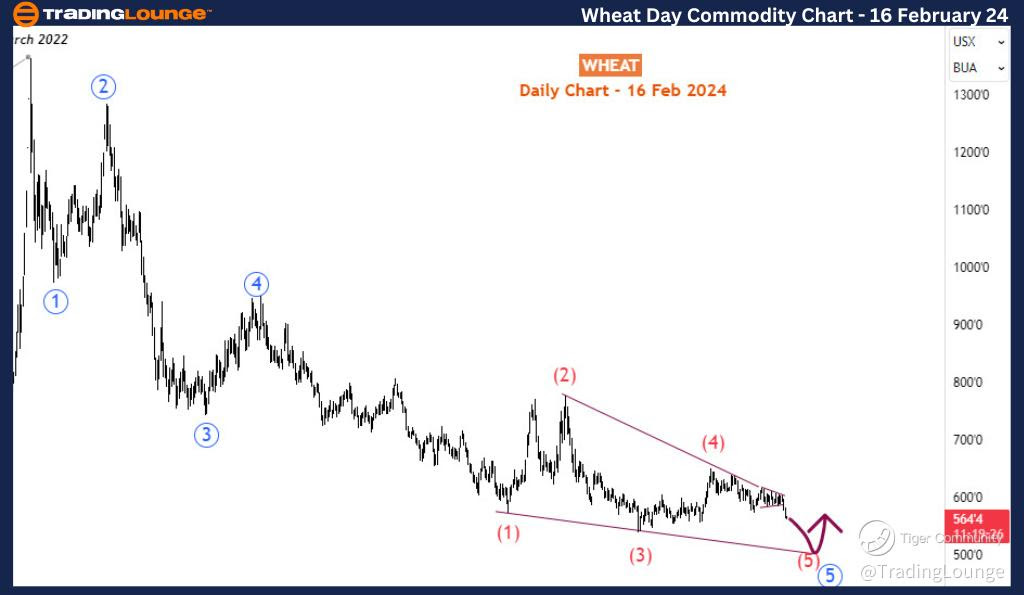
On the daily timeframe, we can easily spot a bearish impulse wave pattern that began in March 2022 for 1364. This bearish impulse is now in its final stage, with its 5th wave (shown in blue) forming an ending diagonal structure. This was our long-term forecast, and we informed our subscribers to closely monitor the price action of this commodity. Meanwhile, the 5th wave (wave 5 in red) of the diagonal is still in progress. By zooming in on the hourly timeframe, we can observe a bearish setup that aligns with this forecast.

Traders who prefer the daily timeframe will need to wait for the completion of the diagonal before looking for bullish opportunities. According to Elliott's wave theory, a 3-wave bullish correction is anticipated to follow. Now, let's shift our focus to the H4 timeframe.

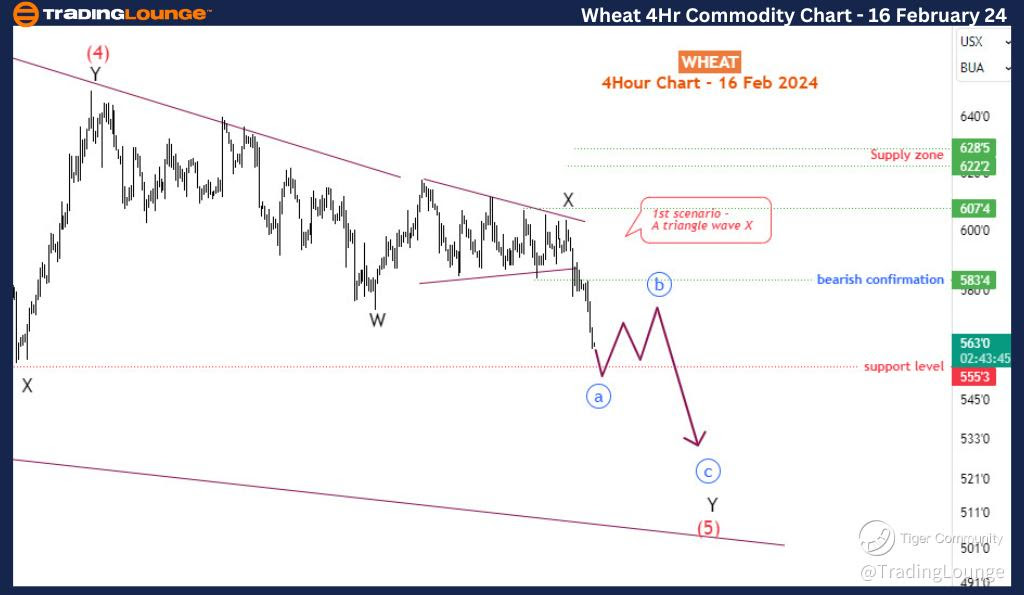
Looking at the 4-hour timeframe, we examined the sub-waves of the red wave 5. It appears to divide into what could potentially be a double zigzag pattern: wave W-X-Y (shown in black). After wave W concluded, the price entered a sideways range for 4 weeks as part of wave X. In our recent updates, we identified 583 as the breakout point for wave Y, where this commodity is likely to attract more sellers.

As the chart illustrates, the subsequent sell-off was rapid. In the latest update, we presented this chart to show the ongoing developments. Moving forward, wave Y is expected to further sub-divide into another zigzag structure. Meanwhile, as the price approaches a crucial support level, we might witness the end of the blue sub-wave ‘a’, followed by a corrective rally for blue sub-wave ‘b’, and then a further sell-off.

Although there are several potential paths this market could take, this currently appears to be the clearest scenario from our perspective.

Technical Analyst: Sanmi Adeagbo

Source: visit Tradinglounge.com and learn From the Experts Join TradingLounge Here 

See Previous: WTI Crude Oil 
Wheat-Day-commodity-...


Wheat Elliott Wave Technical Analysis 4-Hour Chart,16 February 24
 

Wheat-4hr-commodity-...

Related

Elliott Wave Analysis Update: Stability and Opportunities in Commodity Markets

Elliott Wave Analysis Update: Stability and Opportunities in Commodity Markets

The latest Elliott Wave analysis of commodity markets shows unchanged wave counts. Bitcoin is confir...

Read More >
ASX Trading Wisetech Global Limited Stock Analysis & WTC Elliott Wave Technical Forecast to Enhance your Trading Strategy

ASX Trading Wisetech Global Limited Stock Analysis & WTC Elliott Wave Technical Forecast to Enhance your Trading Strategy

Stay ahead in the market with our comprehensive Elliott Wave analysis of Wisetech Global Limited (WT...

Read More >
Dogecoin Crypto Price prediction News using DOGEUSD Elliott Wave Technical Analysis with Charts Insight

Dogecoin Crypto Price prediction News using DOGEUSD Elliott Wave Technical Analysis with Charts Insight

This analysis provides a detailed Dogecoin price prediction using DOGEUSD Elliott Wave analysis. Lea...

Read More >
Elliott Wave Technical Analysis: Indices Overview S&P 500, NASDAQ 100, RUSSELL 2000, DAX 40, FTSE 100, ASX 200

Elliott Wave Technical Analysis: Indices Overview S&P 500, NASDAQ 100, RUSSELL 2000, DAX 40, FTSE 100, ASX 200

In this analysis, we take a comprehensive look at the S&P 500, NASDAQ 100, Russell 2000, DAX 40, FTS...

Read More >
Unlocking Potential Gains: META Platforms Inc. (META) Elliott Wave Technical Analysis offering actionable insights

Unlocking Potential Gains: META Platforms Inc. (META) Elliott Wave Technical Analysis offering actionable insights

Elliott Wave Analysis for META Platforms Inc. (META) dated February 16, 2024, offering actionable in...

Read More >
Maximizing Profits: Procter & Gamble (PG) Elliott Wave Technical Analysis Unveils Lucrative Trends

Maximizing Profits: Procter & Gamble (PG) Elliott Wave Technical Analysis Unveils Lucrative Trends

Explore the latest Elliott Wave analysis for The Procter & Gamble Company (PG). Delve into comprehen...

Read More >

Buy 1 Month

Get 3 Months!

Special Offer:

Trade Recommendations

Unleash the power of deversified trading with our comprehensive portfolio, covering:

  • Stock Trades
  • Crypto Trades
  • Forex Trades
  • Commodity Trades
Elliott Wave Analysis

Gain a competive edge with expert insights in to:

  • Global Indices
  • US Stocks & ASX Stocks
  • Forex & Crypto
  • Commodities
Top-Notch Trading Tools

Equip yourself with the tools of success:

  • Social Chat
  • Elliott Wave Algorithm
  • Screener
  • TradingLevels
  • Trading Game
7 Elliott Wave Analysts

Stay ahead of the market with daily charts and insightful videos
-Your secret to strategic trading!

JOIN HERE


Welcome to TradingLounge (ASIC A.R.No. 321187), specialists in trades, trading education and technical analysis, covering stocks, indices, commodities, forex and cryptocurrencies.

When you join TradingLounge you have access to everything we offer, including trade tools, educational content and a social platform to chat with like-minded investors.

Read more

@Copyright 2024 by tradinglounge.com

Contact Us

Australian no: 02 4787 6020

International no: +61 (2) 47876020

Pay with:

Find us on