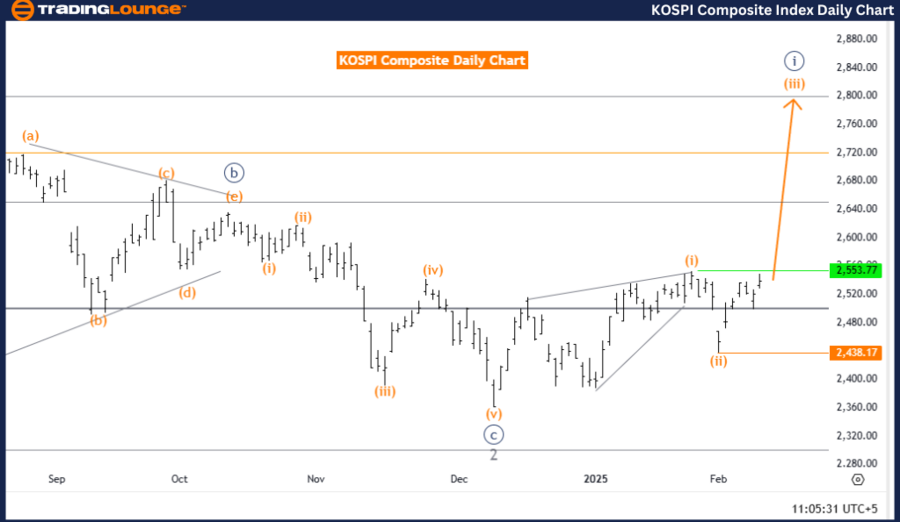
KOSPI Composite Elliott Wave Analysis – Trading Lounge Day Chart
KOSPI Composite Elliott Wave Technical Analysis
Function: Bullish Trend
Mode: Impulsive
Structure: Orange wave 3
Position: Navy blue wave 1
Direction Next Higher Degrees: Orange wave 3 (Started)
Details: Orange wave 2 appears completed, and orange wave 3 is currently in progress.
Wave Cancel Invalidation Level: 2,438.17
KOSPI Day Chart Analysis Overview
The KOSPI Composite Index exhibits a bullish trend based on Elliott Wave analysis, with an ongoing impulsive wave structure. The market is currently within orange wave 3, which signals strong upward momentum and a potential rally in the coming sessions.
At this stage, navy blue wave 1 is forming, indicating the early phase of a broader uptrend. The completion of orange wave 2 marks the end of the corrective phase, paving the way for the dynamic expansion of orange wave 3. This wave is typically associated with high momentum and increased trading opportunities.
Bullish Momentum & Trading Implications
With orange wave 3 gaining traction, traders should anticipate potential price surges during this phase. As part of the impulsive wave sequence, this wave is a crucial driver of price acceleration, making it a key phase for market participants.
- Key Trading Focus: Monitor price action closely as orange wave 3 develops.
- Invalidation Level: 2,438.17 – A drop below this threshold would invalidate the current Elliott Wave structure, requiring a market reassessment.
Strategic traders should leverage this phase by aligning trading strategies with bullish momentum, ensuring positions are well-placed within the impulsive wave trend.
Conclusion
The KOSPI Composite Index maintains a bullish outlook, with the primary market movement being orange wave 3 within navy blue wave 1. The completion of orange wave 2 signals a continuation of upward momentum, presenting favorable trading opportunities.
Traders should closely monitor price action near the invalidation level (2,438.17) to maintain an accurate market perspective and capitalize on bullish trends effectively.
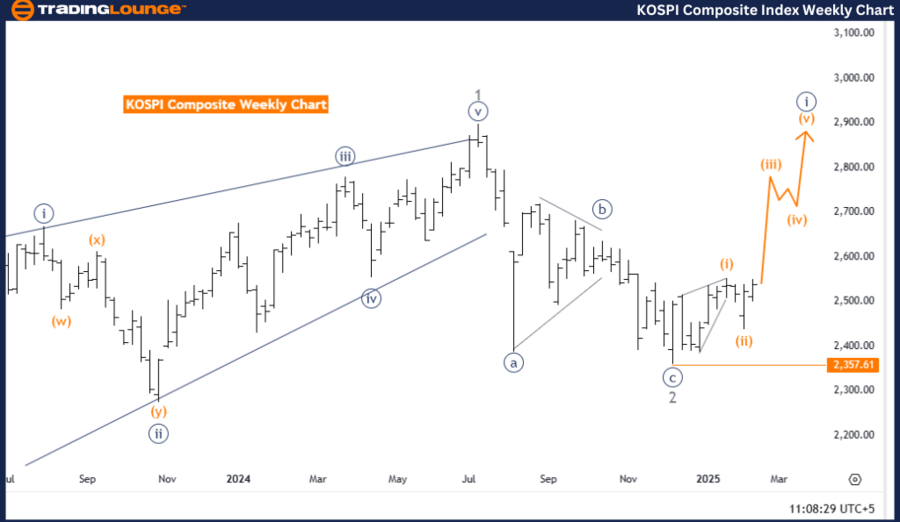
KOSPI Composite Elliott Wave Analysis – Trading Lounge Weekly Chart
KOSPI Composite Elliott Wave Technical Analysis
Function: Bullish Trend
Mode: Impulsive
Structure: Orange wave 3
Position: Navy blue wave 1
Direction Next Higher Degrees: Orange wave 3 (Started)
Details: Orange wave 2 appears completed, and orange wave 3 is currently in progress.
Wave Cancel Invalidation Level: 2,357.61
KOSPI Weekly Chart Analysis Overview
The KOSPI Composite Weekly Chart reflects a strong bullish trend, backed by Elliott Wave analysis. The market remains in orange wave 3, indicating continued upside momentum after completing the corrective phase.
This wave structure is part of navy blue wave 1, representing the initial stage of a long-term bullish cycle. With orange wave 2 now completed, the market has entered the dynamic expansion phase of orange wave 3, often linked to significant price growth and key trading opportunities.
Bullish Momentum & Trading Implications
The continuation of orange wave 3 strengthens bullish sentiment, with traders anticipating sustained upward movement. Being one of the strongest phases in an impulsive Elliott Wave sequence, this wave often drives increased market participation and potential price acceleration.
- Key Trading Focus: Orange wave 3 typically leads to heightened market activity and bullish price action.
- Invalidation Level: 2,357.61 – If breached, the current wave structure becomes invalid, requiring a market outlook reassessment.
Traders should actively monitor price action around this threshold to adjust trading strategies accordingly.
Conclusion
The KOSPI Composite Weekly Chart confirms a bullish trajectory, primarily driven by the development of orange wave 3 within navy blue wave 1. The completion of orange wave 2 reinforces upward momentum, offering strategic trading opportunities for market participants.
Tracking market movements near the invalidation level (2,357.61) is crucial to maintaining an accurate trading perspective and effectively positioning within the prevailing trend.
Technical Analyst: Malik Awais
Source: visit Tradinglounge.com and learn From the Experts Join TradingLounge Here
Previous: S&P 500 Elliott Wave Technical Analysis
VALUE Offer - Buy 1 Month & Get 3 Months!Click here
Access 7 Analysts Over 200 Markets Covered. Chat Room With Support