Power Grid Corp Elliott Wave Analysis | TradingLounge (1D Chart)

POWERGRIDCORP Elliott Wave Technical Analysis

Function: Counter Trend (Minute Degree, Navy)

Mode: Corrective

Structure: Potential impulse within a larger degree correction

Position: Minute Wave ((i))

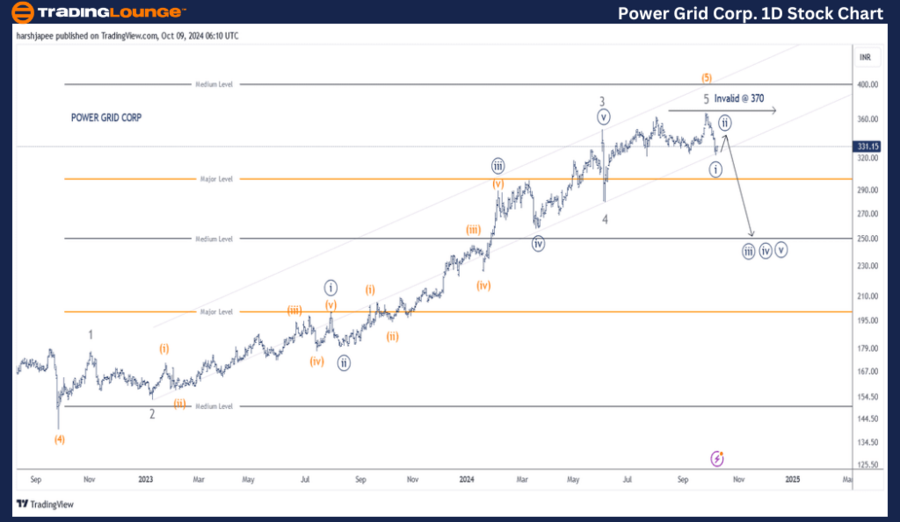
Details: The structure has been updated as the price action confirms a drop below 320. Intermediate Wave (5) Orange could be complete around the 370 level as prices turn lower, likely ending Minute Wave ((i)) around 320. If this count is accurate, we can expect a rally for Minute Wave ((ii)) before bears regain control.

Invalidation Point: 370

Power Grid Corp Chart Technical Analysis and Potential Elliott Wave Counts:

Power Grid Corp’s daily chart suggests a potential structural shift over recent trading sessions, with the stock dropping below the 320 level. A possible top may have formed around 370, short of the Fibonacci projection, completing Intermediate Wave (5) Orange.

Since September 2022, the stock has been rallying after bottoming out around 140, marking the end of Intermediate Wave (4) Orange. Minor Wave 3 of Intermediate Wave (5) extended and completed around the 350 level, while Wave 4 sharply corrected below 280 on June 4, 2024.

The rally toward 370 could represent the termination of Minor Wave 5 Grey within Intermediate Wave (5) Orange, as subsequent price action breaks below the 320 support. Alternatively, the recent low could signal an expanded flat Minute Wave ((iv)) with potential for another push higher to complete the structure. This alternative count will be reassessed later.

Power-Grid-Corp-1D-S...


Power Grid Corp Elliott Wave Analysis | TradingLounge (4H Chart)

POWERGRIDCORP  Elliott Wave Technical Analysis

Function: Counter Trend (Minute Degree, Navy)

Mode: Corrective

Structure: Potential impulse within a larger degree correction

Position: Minute Wave ((i))

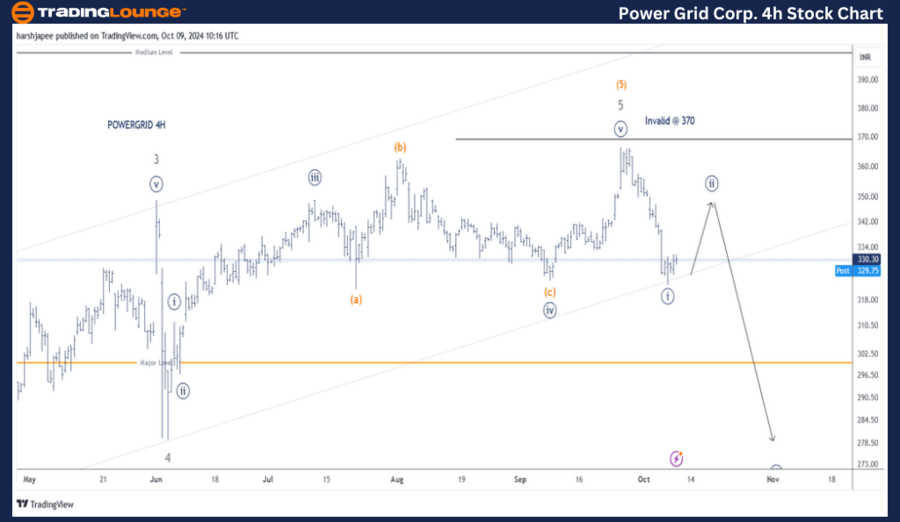
Details: The proposed structure has been revised as price action confirms a decline through the 320 level. Intermediate Wave (5) Orange could now be complete near 370, with prices moving lower to end Minute Wave ((i)) around 320. If correct, expect a rally to carve out Minute Wave ((ii)) before the bears take charge again.

Invalidation Point: 370

Power Grid Corp 4H Chart Technical Analysis and Potential Elliott Wave Counts:

The 4H chart of Power Grid Corp indicates a potential subdivision of Minor Wave 5 Grey. Minute Wave ((iv)) is marked as a running flat, with the internal subdivisions of Minute Wave ((v)) being unclear. However, this count suggests prices have broken below the 320 level.

Technical Analyst: Harsh Japee

Source: visit Tradinglounge.com and learn From the Experts Join TradingLounge Here 

Previous: Hero MotoCorp Elliott Wave Technical Analysis

VALUE Offer - Buy 1 Month & Get 3 Months!Click here

Access 7 Analysts Over 200 Markets Covered. Chat Room With Support

Power-Grid-Corp-4h-S...


Conclusion:

Power Grid Corp may have topped around 370, with the bears pushing Minute Wave ((i)) below 320. A minor rally could occur to complete Minute Wave ((ii)) before the trend likely turns lower again.

Related

Grasim Industries Elliott Wave Forecast: Chart Analysis Shows Bullish Momentum and Strong Upside in Indian Stock Market

Grasim Industries Elliott Wave Forecast: Chart Analysis Shows Bullish Momentum and Strong Upside in Indian Stock Market

Grasim Industries shows a bullish Elliott Wave pattern on both daily and weekly charts, forecasting ...

Read More >
SPDR Select Sector Fund ETF – XLF Elliott Wave Analysis Projects Wave 3 Breakout with Key Support and Bullish ETF Trading Opportunity

SPDR Select Sector Fund ETF – XLF Elliott Wave Analysis Projects Wave 3 Breakout with Key Support and Bullish ETF Trading Opportunity

XLF is in a bullish wave 3 with targets beyond $52.64. This Elliott Wave analysis highlights key bre...

Read More >
JP Morgan Stock Analysis: Elliott Wave Insights, Price Targets, Daily and Hourly Chart Breakdown, and Trading Strategies

JP Morgan Stock Analysis: Elliott Wave Insights, Price Targets, Daily and Hourly Chart Breakdown, and Trading Strategies

This comprehensive analysis of JP Morgan & Chase Co. explores the stock's Elliott Wave patterns,...

Read More >
UNI/USD Elliott Wave Technical Analysis: Price Predictions, Technical Indicators and Profitable Trading Strategies

UNI/USD Elliott Wave Technical Analysis: Price Predictions, Technical Indicators and Profitable Trading Strategies

Elliott Wave analysis of UNI/USD, highlighting key technical indicators, corrective wave structures,...

Read More >
Bitcoin/U.S. dollar(BTCUSD) Elliott Wave Technical Analysis 25 October 23

Bitcoin/U.S. dollar(BTCUSD) Elliott Wave Technical Analysis 25 October 23

Bitcoin/U.S. dollar(BTCUSD) Elliott Wave Technical Analysis on 25 October 23 with BTCUSD Analysis Da...

Read More >
Latest Elliott Wave technical Analysis for Fisher & Paykel Healthcare (FPH) stock on the ASX Market: Learn How FPH Could Move

Latest Elliott Wave technical Analysis for Fisher & Paykel Healthcare (FPH) stock on the ASX Market: Learn How FPH Could Move

Discover the latest Elliott Wave technical analysis for Fisher & Paykel Healthcare (FPH) stock on th...

Read More >

Buy 1 Month

Get 3 Months!

Special Offer:

Trade Recommendations

Unleash the power of deversified trading with our comprehensive portfolio, covering:

  • Stock Trades
  • Crypto Trades
  • Forex Trades
  • Commodity Trades
Elliott Wave Analysis

Gain a competive edge with expert insights in to:

  • Global Indices
  • US Stocks & ASX Stocks
  • Forex & Crypto
  • Commodities
Top-Notch Trading Tools

Equip yourself with the tools of success:

  • Social Chat
  • Elliott Wave Algorithm
  • Screener
  • TradingLevels
  • Trading Game
7 Elliott Wave Analysts

Stay ahead of the market with daily charts and insightful videos
-Your secret to strategic trading!

JOIN HERE


Welcome to TradingLounge (ASIC A.R.No. 321187), specialists in trades, trading education and technical analysis, covering stocks, indices, commodities, forex and cryptocurrencies.

When you join TradingLounge you have access to everything we offer, including trade tools, educational content and a social platform to chat with like-minded investors.

Read more

@Copyright 2024 by tradinglounge.com

Contact Us

Australian no: 02 4787 6020

International no: +61 (2) 47876020

Pay with:

Find us on