Welcome to our latest Elliott Wave analysis on the Australian Stock Exchange (ASX) featuring CSL LIMITED – CSL. We aim to provide an insightful overview of CSL’s stock movement using Elliott Wave principles.
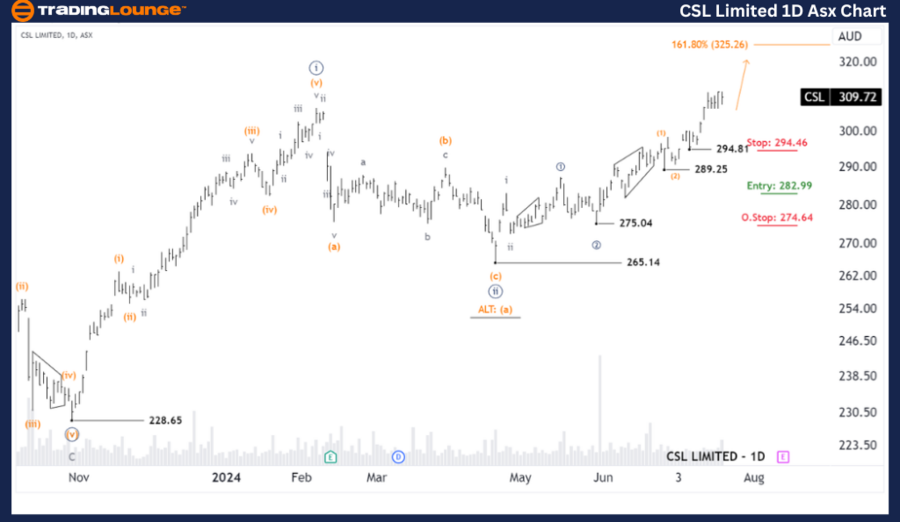
ASX: CSL LIMITED – CSL Elliott Wave Technical Analysis (1D Chart)
ASX: CSL LIMITED – CSL Day Chart Analysis
CSL Elliott Wave Technical Analysis
Function: Major trend (Minute degree, navy)
Mode: Motive
Structure: Impulse
Position: Wave (3) - orange of Wave ((3)) - navy of Wave iii - gray of Wave ((iii)) - navy
Details: Wave (3) - orange is advancing, targeting 325.26, requiring the price to stay above 294.81. This view holds as long as the price does not dip below this level. The Long Trade position in CSL has been profitable and is expected to continue growing.
Invalidation point: 294.81

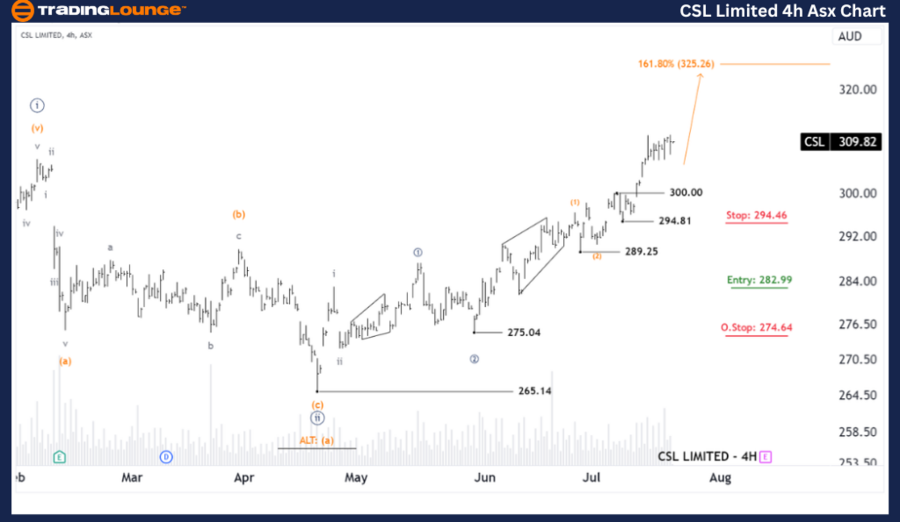
ASX: CSL LIMITED – CSL Elliott Wave Technical Analysis (4-Hour Chart)
ASX: CSL LIMITED – CSL 4-Hour Chart Analysis
Function: Major trend (Minuette degree, orange)
Mode: Motive
Structure: Impulse
Position: Wave (3) - orange of Wave ((3)) - navy of Wave iii - gray of Wave ((iii)) - navy
Details: Wave (3) - orange is still in an upward trajectory, aiming for 325.26, with the price needing to stay above 300.00 to maintain this outlook. The Long Trade position in CSL remains profitable and is poised for further gains.
Invalidation point: 300.00
Conclusion
Our analysis comprehensively forecasts CSL LIMITED – CSL’s market trends and short-term outlook. We highlight specific price points that act as validation or invalidation signals, bolstering confidence in our wave count. By integrating these elements, we offer an objective and professional perspective on market trends.
Technical Analyst: Hua (Shane) Cuong, CEWA-M (Master’s Designation).
Source: visit Tradinglounge.com and learn From the Experts Join TradingLounge Here
Previous: ASX: SOUTH32 LIMITED – S32 Elliott Wave Technical Analysis
Special Trial Offer - 0.76 Cents a Day for 3 Months! Click here
Access 7 Analysts Over 170 Markets Covered. Chat Room With Support
