ASX: REA Group Ltd - REA Elliott Wave Technical Analysis (1D Chart)

Greetings, today's Elliott Wave analysis focuses on the Australian Stock Exchange (ASX) with REA Group Ltd - REA. We observe that REA could potentially rise further with the third wave of the third wave.

ASX: REA Group Ltd - REA Elliott Wave Technical Analysis

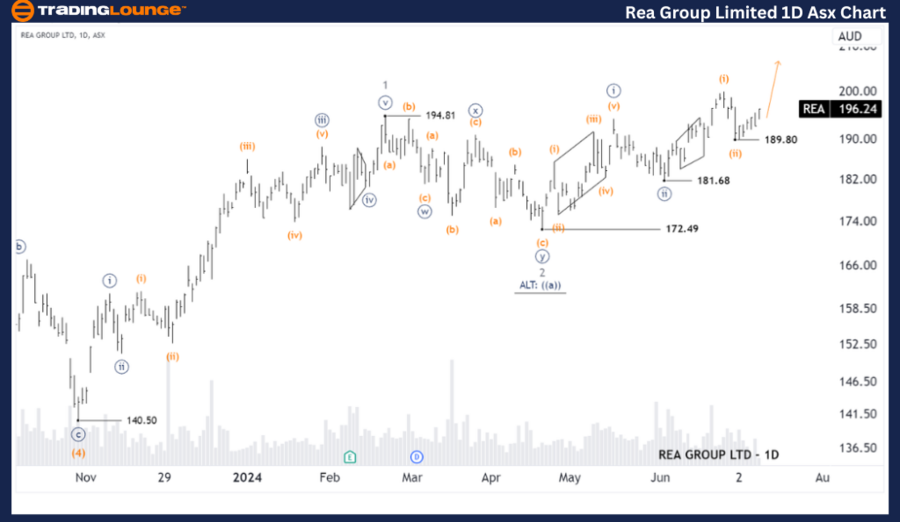
ASX: REA Group Ltd - REA 1D Chart (Semilog Scale) Analysis

Function: Major trend (Minor degree, grey)

Mode: Motive

Structure: Impulse

Position: Wave iii - gray of Wave (iii) - orange of Wave 3 - gray

Details: The short-term outlook indicates that wave iii - gray is progressing to push higher, with the price needing to remain above 181.68.

Invalidation point: 181.68

REA-Group-Ltd-1D-Asx...


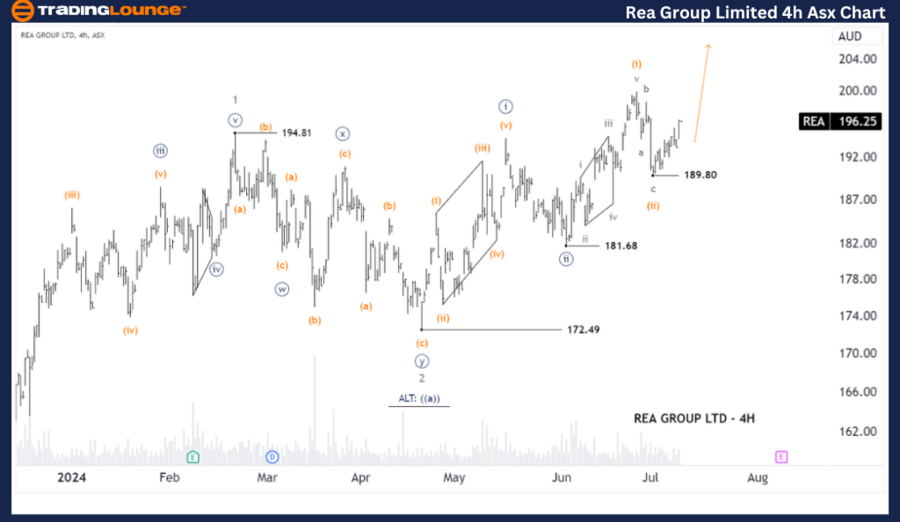
ASX: REA Group Ltd - REA Elliott Wave Analysis TradingLounge (4-Hour Chart)

ASX: REA Group Ltd - REA Elliott Wave Technical Analysis

ASX: REA Group Ltd - REA 4-Hour Chart Analysis

Function: Major trend (Minuette degree, orange)

Mode: Motive

Structure: Impulse

Position: Wave (iii) - orange of Wave ((iii)) - navy of Wave 3 - grey

Details: Wave (iii) - orange of wave ((iii)) - navy is advancing to push higher. It is crucial that the price stays above 189.80 to sustain this outlook.

Invalidation point: 189.80

Conclusion: Our analysis and forecast of contextual trends, alongside the short-term outlook for ASX: REA Group Ltd - REA, aim to provide insights into current market trends and how to leverage them effectively. We offer specific price points as validation or invalidation signals for our wave count, enhancing confidence in our perspective. By integrating these elements, we strive to deliver the most objective and professional perspective on market trends.

Technical Analyst: Hua (Shane) Cuong, CEWA-M (Master’s Designation).

Source: visit Tradinglounge.com and learn From the Experts Join TradingLounge Here 

Previous: Woolworths Group Elliott Wave Technical Analysis

Special Trial Offer - 0.76 Cents a Day for 3 Months! Click here

Access 7 Analysts Over 170 Markets Covered. Chat Room With Support

REA-Group-Ltd-4h-Asx...

Related

Advanced Micro Devices Inc. (AMD) Elliott Wave Analysis: Daily & 1-Hour Chart Insights, Fibonacci Levels, and Stock Forecast

Advanced Micro Devices Inc. (AMD) Elliott Wave Analysis: Daily & 1-Hour Chart Insights, Fibonacci Levels, and Stock Forecast

AMD's Elliott Wave patterns, covering daily and 1-hour chart movements. Key insights include the...

Read More >
Spot Opportunities in the Emerging Crypto Market using Advanced Chart Analysis: Bitcoin (BTCUSD) Elliott Wave Analysis

Spot Opportunities in the Emerging Crypto Market using Advanced Chart Analysis: Bitcoin (BTCUSD) Elliott Wave Analysis

In this analysis, we explore Bitcoin’s price movement through Elliott Wave theory, offering insight...

Read More >
Bullish Outlook Confirmed: Elliott Wave Analysis Signals Uptrend for Major Global Indices

Bullish Outlook Confirmed: Elliott Wave Analysis Signals Uptrend for Major Global Indices

Index Analysis: S&P 500 (SPX): Action: Considering a long position at 5,850. Pattern: Observing...

Read More >
U.S. Dollar / Canadian Dollar (USDCAD) Elliott Wave Technical Analysis: Forex Trading Strategy, Price Prediction, Market Trends

U.S. Dollar / Canadian Dollar (USDCAD) Elliott Wave Technical Analysis: Forex Trading Strategy, Price Prediction, Market Trends

The USDCAD Elliott Wave Analysis provides a detailed technical forecast, highlighting the bearish tr...

Read More >
Cardano (ADAUSD) Elliott Wave Analysis: Resistance & Support Levels, Crypto Market Trends, and Technical Analysis

Cardano (ADAUSD) Elliott Wave Analysis: Resistance & Support Levels, Crypto Market Trends, and Technical Analysis

Elliott Wave Analysis of ADA/USD, highlighting Cardano's price projections, technical analysis, ...

Read More >
ITC Stock Elliott Wave Forecast: Bullish Trend, Wave 5 in Progress, Price Target Analysis, Key Level at ₹390

ITC Stock Elliott Wave Forecast: Bullish Trend, Wave 5 in Progress, Price Target Analysis, Key Level at ₹390

ITC shows a bullish Elliott Wave structure with upward momentum on both daily and weekly charts. Wav...

Read More >

$1 for 2 Weeks

then $29 a month!

What a Special Offer!

Trade Recommendations

Unleash the power of deversified trading with our comprehensive portfolio, covering 250+ markets:

  • Stock Trades
  • Crypto Trades
  • Forex Trades
  • Commodity Trades
Elliott Wave Analysis

Gain a competitive edge with expert insights and AI-powered Elliott Wave charting into:

  • Global Indices
  • US Stocks & ASX Stocks
  • Forex & Crypto
  • Commodities
Top-Notch Trading Tools

Equip yourself with the tools of success:

  • Real-time Chat rooms
  • Elliott Wave Algorithm
  • Portfolio tools
  • TradingLevels
  • Screener
  • Trading Game
7 Elliott Wave Analysts

Stay ahead of the market with daily charts and insightful videos
Your secret to strategic trading!

JOIN HERE


Welcome to TradingLounge (ASIC A.R.No. 321187), specialists in trades, trading education and technical analysis, covering stocks, indices, commodities, forex and cryptocurrencies.

When you join TradingLounge you have access to everything we offer, including trade tools, educational content and a social platform to chat with like-minded investors.

Read more

@Copyright 2024 by tradinglounge.com

Contact Us

Australian no: 02 4787 6020

International no: +61 (2) 47876020

Pay with:

Find us on