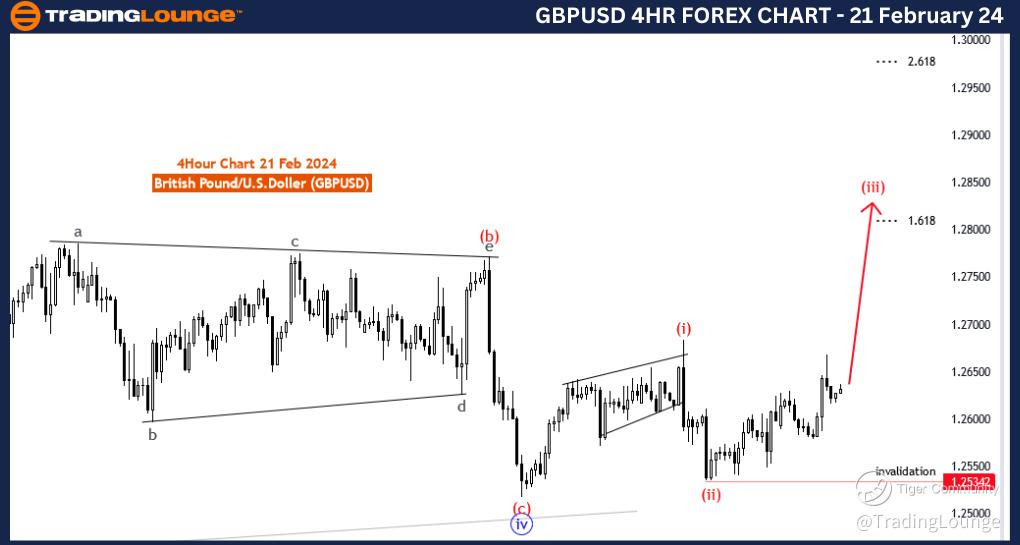
GBPUSD Elliott Wave Analysis Trading Lounge 4 Hour Chart, 21 February 24
British Pound/U.S.Dollar (GBPUSD) 4 Hour Chart
GBPUSD Elliott Wave Technical Analysis
FUNCTION: Trend
MODE: Impulsive
STRUCTURE: red wave 3
POSITION: Blue Wave 5
DIRECTION NEXT LOWER DEGREES: red wave 4
DETAILS: red wave 2 of 5 looking completed at 1.25342. Now red wave 3 of 5 is in play. Wave Cancel invalid level: 1.25342
The "GBPUSD Elliott Wave Analysis Trading Lounge 4 Hour Chart" dated 21 February 24, presents a detailed analysis of the British Pound/U.S. Dollar (GBPUSD) currency pair using Elliott Wave principles. The focus is on identifying potential price movements within the context of the Elliott Wave theory.
The identified "FUNCTION" in this analysis is "Trend," suggesting that the assessment revolves around identifying and riding the prevailing trend in the market. Trend analysis is crucial for traders looking to align their positions with the dominant market direction.
The specified "MODE" is "Impulsive," indicating that the market is currently in a phase characterized by strong and directional price movements. Impulsive waves are integral to the Elliott Wave theory and represent the powerful, trending phase of the market.
The described "STRUCTURE" is "Red wave 3," signifying the current phase in the Elliott Wave sequence. Wave 3 is typically the most powerful and extended wave within the five-wave pattern, making it a critical phase for traders to identify and capitalize on significant price movements.
The designated "POSITION" is "Blue Wave 5," indicating the current position within the broader Elliott Wave pattern. Wave 5 is the final phase in the impulsive sequence, and traders often look for signs of a potential reversal or corrective phase as it approaches completion.
Concerning "DIRECTION NEXT LOWER DEGREES," the analysis points to "Red wave 4," indicating the expected direction of the next lower-degree wave. This information is valuable for traders looking to manage risk and identify potential entry or exit points.
In the "DETAILS" section, it is highlighted that "red wave 2 of 5 looking completed at 1.25342. Now red wave 3 of 5 is in play." This suggests that the market has completed a corrective phase (wave 2) and is now in the early stages of the powerful and directional wave 3.
In conclusion, the GBPUSD Elliott Wave Analysis for the 4-hour chart on 21 February 24, indicates an impulsive trend with the market currently in the red wave 3 of 5. Traders are advised to monitor the progression of this wave for potential trading opportunities and to be aware of the invalidation level at 1.25342.
Technical Analyst: Malik Awais
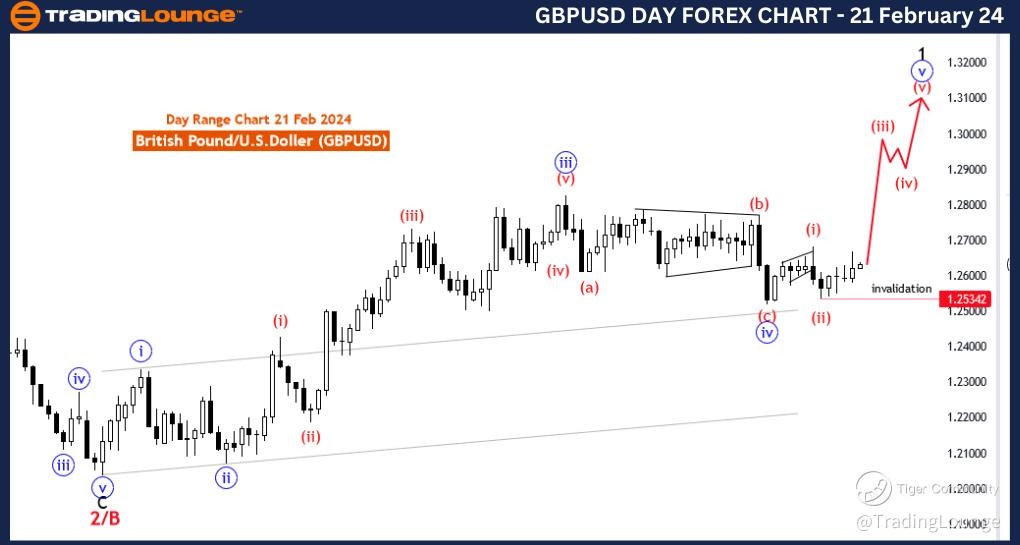
GBPUSD Elliott Wave Analysis Trading Lounge Day Chart, 21 February 24
British Pound/U.S.Dollar (GBPUSD) Day Chart
GBPUSD Elliott Wave Technical Analysis
FUNCTION: Trend
MODE: Impulsive
STRUCTURE: Blue wave 5
POSITION: Black Wave 1
DIRECTION NEXT HIGHER DEGREES: Blue wave 5 (continue)
DETAILS: Blue wave 4 of 1 looking completed. Now blue wave 5 of 1 is in play. Wave Cancel invalid level: 1.25342
The "GBPUSD Elliott Wave Analysis Trading Lounge Day Chart" dated 21 February 24, provides a comprehensive analysis of the British Pound/U.S. Dollar (GBPUSD) currency pair based on Elliott Wave principles. The analysis aims to discern potential price movements within the framework of the Elliott Wave theory, which is widely used by traders to identify trends and turning points in financial markets.
The identified "FUNCTION" in this analysis is "Trend," indicating that the focus is on understanding and capitalizing on the prevailing trend in the market. Recognizing and trading in the direction of the overall trend is a fundamental strategy for many traders.
The specified "MODE" is "Impulsive," suggesting that the market is currently exhibiting strong and directional price movements. Impulsive waves are characterized by a swift and forceful market movement in the direction of the prevailing trend.
The described "STRUCTURE" is "Blue wave 5," highlighting the current phase within the Elliott Wave sequence. Wave 5 is typically the final phase of the impulsive sequence and is characterized by strong upward or downward movements, depending on the trend direction.
The designated "POSITION" is "Black wave 1," signifying the current position within the broader Elliott Wave pattern. Wave 1 is often the initial phase of a new trend and is closely monitored by traders for potential entry points.
Concerning "DIRECTION NEXT HIGHER DEGREES," the analysis points to "Blue wave 5 (continue)," indicating that the upward trend represented by Blue wave 5 is expected to persist.
In the "DETAILS" section, it is mentioned that "Blue wave 4 of 1 looking completed. Now blue wave 5 of 1 is in play." This indicates that a corrective phase (wave 4) has likely concluded, and the market is now in the early stages of the impulsive wave 5.
The "Wave Cancel invalid level" is specified as 1.25342. This level is crucial for traders as it represents the point at which the current wave count would be invalidated.
In summary, the GBPUSD Elliott Wave Analysis for the day chart on 21 February 24, suggests an impulsive trend with the market in the early stages of Blue Wave 5 of 1. Traders are advised to monitor the progression of this wave and be aware of the invalidation level at 1.25342.
Technical Analyst: Malik Awais
Source: visit Tradinglounge.com and learn From the Experts Join TradingLounge Here
See Previous: British Pound/ Australian Dollar(GBPAUD)