Coffee Commodity Elliott Wave Technical Analysis

Coffee prices are nearing the February 2022 highs, showing a strong recovery from the October 2023 lows. Since then, coffee has surged by approximately 75%, indicating a strong uptrend. However, this rally is now approaching a critical point where profit-taking and selling pressure could intensify.

Long-Term Chart Analysis

Coffee Elliott Wave Technical Analysis

Historically, coffee prices have moved within a wide trading range, with support levels between $40 and $55 and resistance levels between $276 and $337. The current bullish cycle began in May 2019. The initial phase of this uptrend peaked in February 2022, reaching key highs. This was followed by a corrective phase that bottomed out in January 2023. The ongoing third phase of this bullish cycle started after this low and is unfolding in what appears to be a corrective pattern within the broader Elliott wave structure.

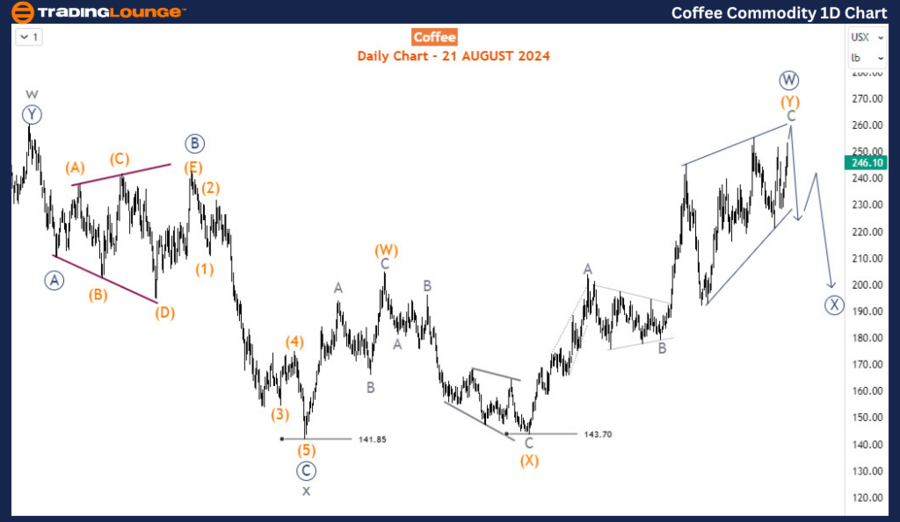
Coffee Commodity Daily Chart Analysis

The daily chart shows that the third phase of this recovery completed its first leg, labeled as wave (W), in April 2023. Afterward, coffee entered a three-wave corrective structure known as wave (X), which found support at 143.70 in October 2023. The current rally represents wave (Y) of the primary degree wave W (circled). Upon the completion of this move, a significant pullback in wave X (circled) is expected, signaling the beginning of the next correction. Given that wave (Y) is nearing the completion of wave W (circled), a major pullback may be imminent.

Coffee-Commodity-1D-...


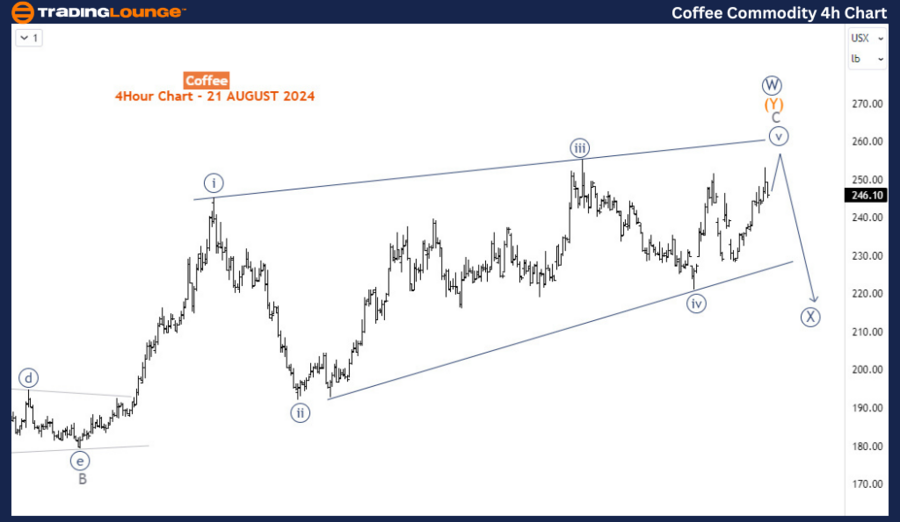
Coffee Commodity H4 Chart Analysis

On the H4 chart, wave (Y) of W (circled) is close to finishing, likely within an ending diagonal pattern, which often indicates trend exhaustion. This structure is expected to complete slightly above the 250 price level. If coffee encounters resistance around this level and fails to sustain rallies beyond 250, a corrective decline is anticipated in the coming weeks. This would align with the broader Elliott wave analysis, supporting the scenario of a multi-month correction as the market transitions into wave X (circled) of the higher-degree structure.

Technical Analyst: Sanmi Adeagbo

Source: visit Tradinglounge.com and learn From the Experts Join TradingLounge Here 

See Previous: Soybean Elliott Wave Technical Analysis

Special Trial Offer - 0.76 Cents a Day for 3 Months! Click here

Access 7 Analysts Over 200 Markets Covered. Chat Room With Support

Coffee-Commodity-4h-...

This analysis underscores the potential for a significant reversal as coffee approaches key resistance levels, paving the way for a corrective phase ahead.

Related

Binance Wave 3 Breakout: BNBUSD Elliott Wave Analysis and Trading Strategy with Fibonacci Targets and Risk Control Techniques

Binance Wave 3 Breakout: BNBUSD Elliott Wave Analysis and Trading Strategy with Fibonacci Targets and Risk Control Techniques

BNBUSD breaks out of Triangle IV, starting Wave 3 — the strongest trend phase. Learn entry points, ...

Read More >
KOSPI Composite Index Elliott Wave Technical Analysis: Indicates a Strong Bullish Trend with Significant Investment Potential

KOSPI Composite Index Elliott Wave Technical Analysis: Indicates a Strong Bullish Trend with Significant Investment Potential

The latest Elliott Wave analysis on the KOSPI Composite Index indicates a strong bullish trend with ...

Read More >
Unlocking ASX Trading Success: NEWMONT CORPORATION – NEM Stock Analysis & Elliott Wave Technical Forecast

Unlocking ASX Trading Success: NEWMONT CORPORATION – NEM Stock Analysis & Elliott Wave Technical Forecast

Dive into our comprehensive Elliott Wave analysis for NEWMONT CORPORATION (NEM) on the Australian St...

Read More >
Ripple (XRP) Crypto Price News Today and XRPUSD Elliott Wave Technical Analysis: XRP Price Forecast and Trading Strategy

Ripple (XRP) Crypto Price News Today and XRPUSD Elliott Wave Technical Analysis: XRP Price Forecast and Trading Strategy

XRPUSD is completing a Wave 2 A-B-C correction. Watch for bullish signals around $1.90–$1.88 to ent...

Read More >
USDJPY Elliott Wave Analysis: Counter-Trend Corrective Mode Revealed on Day Chart - 24th July 2023

USDJPY Elliott Wave Analysis: Counter-Trend Corrective Mode Revealed on Day Chart - 24th July 2023

The Elliott Wave Analysis for USDJPY on the day chart, conducted on 24th July 2023, reveals a counte...

Read More >
COAL INDIA Elliott Wave Technical Analysis: Daily Wave C Within Gray Wave C & Weekly Impulsive Gray Wave B Under Orange Wave

COAL INDIA Elliott Wave Technical Analysis: Daily Wave C Within Gray Wave C & Weekly Impulsive Gray Wave B Under Orange Wave

The Elliott Wave analysis of COAL INDIA shows a corrective counter‑trend: Navy Blue Wave C within G...

Read More >

$1 for 2 Weeks

then $29 a month!

What a Special Offer!

Trade Recommendations

Unleash the power of deversified trading with our comprehensive portfolio, covering 250+ markets:

  • Stock Trades
  • Crypto Trades
  • Forex Trades
  • Commodity Trades
Elliott Wave Analysis

Gain a competitive edge with expert insights and AI-powered Elliott Wave charting into:

  • Global Indices
  • US Stocks & ASX Stocks
  • Forex & Crypto
  • Commodities
Top-Notch Trading Tools

Equip yourself with the tools of success:

  • Real-time Chat rooms
  • Elliott Wave Algorithm
  • Portfolio tools
  • TradingLevels
  • Screener
  • Trading Game
7 Elliott Wave Analysts

Stay ahead of the market with daily charts and insightful videos
Your secret to strategic trading!

JOIN HERE


Welcome to TradingLounge (ASIC A.R.No. 321187), specialists in trades, trading education and technical analysis, covering stocks, indices, commodities, forex and cryptocurrencies.

When you join TradingLounge you have access to everything we offer, including trade tools, educational content and a social platform to chat with like-minded investors.

Read more

@Copyright 2024 by tradinglounge.com

Contact Us

Australian no: 02 4787 6020

International no: +61 (2) 47876020

Pay with:

Find us on