10Jun

COAL INDIA Elliott Wave Technical Analysis: Daily Wave C Within Gray Wave C & Weekly Impulsive Gray Wave B Under Orange Wave

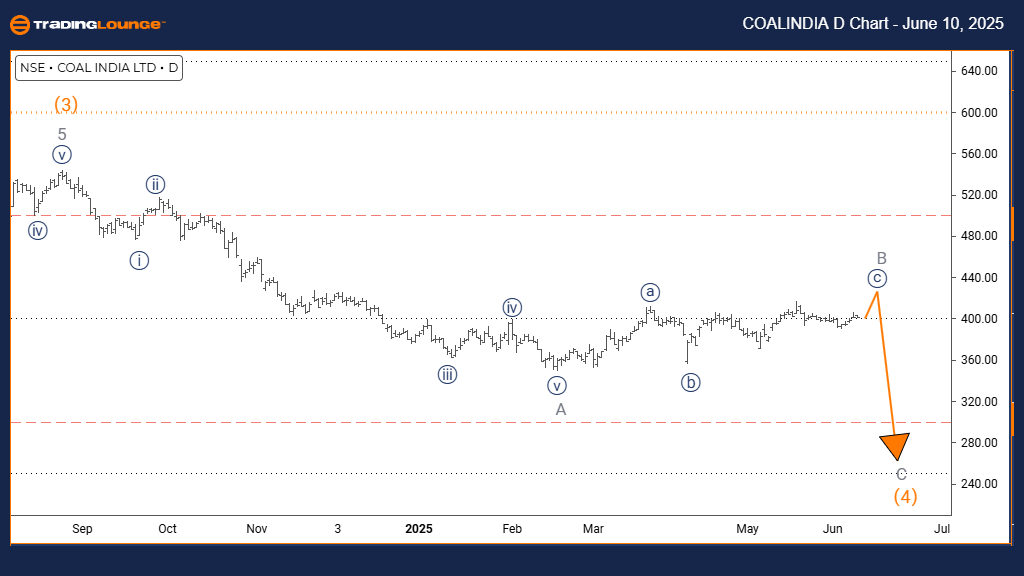
COAL INDIA Elliott Wave Analysis – Tradinglounge Day Chart

COAL INDIA Elliott Wave Technical Analysis

FUNCTION: Counter Trend

MODE: Corrective

STRUCTURE: Navy Blue Wave C

POSITION: Gray Wave C

DIRECTION NEXT LOWER DEGREES: Gray Wave C

DETAILS: Navy Blue Wave B looks completed; Navy Blue Wave C is currently unfolding.

The Elliott Wave daily analysis of COAL INDIA stock indicates a counter-trend corrective formation. This wave structure highlights a corrective pattern in motion rather than a continuation of the primary trend. The current labeling identifies Navy Blue Wave C as active, part of a broader corrective phase represented by Gray Wave C.

As Navy Blue Wave B appears to have ended, the development of Navy Blue Wave C suggests the stock is navigating the final portion of a multi-wave correction. This stage often features movements that run contrary to the prevailing trend and typically leads into a potential reversal.

The progression of Gray Wave C signals that COAL INDIA’s price action is undergoing a key corrective phase. Traders should monitor for the completion of Navy Blue Wave C, as this would indicate that the stock is preparing for a trend resumption.

Given the alignment of multiple corrective waves across different degrees, the current price behavior reinforces the short-term counter-trend nature. Technical traders are advised to remain observant for signs that the corrective wave structure, particularly Navy Blue Wave C within Gray Wave C, has finalized, potentially setting up a trend continuation or reversal.

COAL-INDIA-stock-D-C...


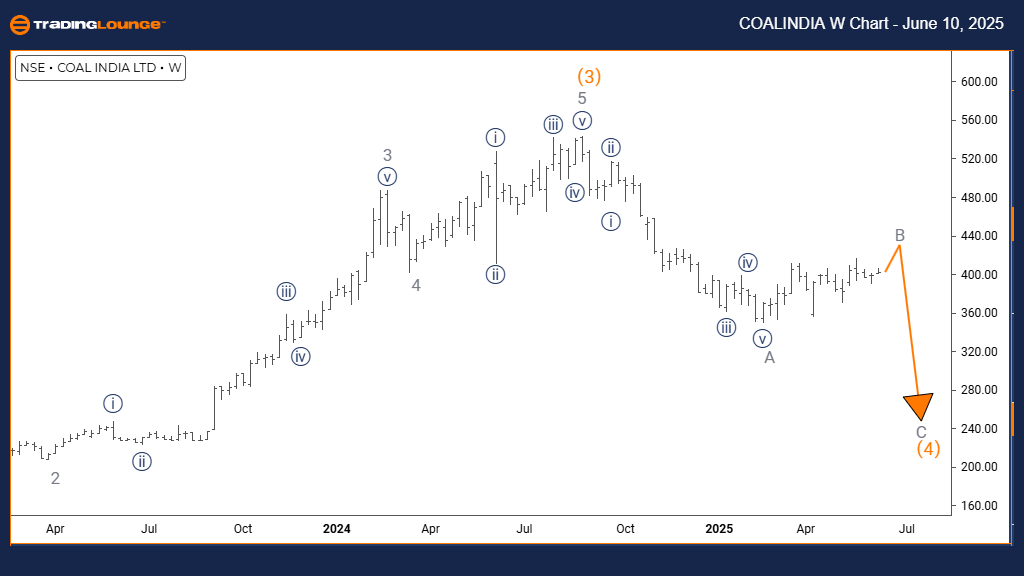
COAL INDIA Elliott Wave Analysis – Tradinglounger Weekly Chart

COAL INDIA Elliott Wave Technical Analysis

FUNCTION: Counter Trend

MODE: Impulsive

STRUCTURE: Gray Wave B

POSITION: Orange Wave 4

DIRECTION NEXT LOWER DEGREES: Gray Wave C

DETAILS: Gray Wave A has likely concluded, with Gray Wave B in progress.

On the weekly time frame, the Elliott Wave outlook for COAL INDIA shows a counter-trend scenario supported by an impulsive wave. This structure develops within Gray Wave B, nested in a larger corrective framework defined by Orange Wave 4, suggesting strong movement against the dominant trend.

With Gray Wave A assumed complete, the focus shifts to the active Gray Wave B, an impulsive correction potentially offering opportunities for traders. Following the conclusion of this wave, Gray Wave C is expected to initiate, likely pushing prices downward and completing the corrective cycle.

The impulsive tone of Gray Wave B reflects a potentially robust interim move. This middle phase of the correction warrants attention, as it may yield tactical setups within a broader counter-trend direction.

Traders should stay alert for the completion of Gray Wave B, as this will likely signal the start of Gray Wave C. Anticipating this transition is vital, as Gray Wave C could represent the final movement of the larger correction, providing a clearer view of future price direction for COAL INDIA.

Technical Analyst: Malik Awais

Source: Visit Tradinglounge.com and learn from the Experts. Join TradingLounge Here 

Previous: DR REDDY LABORATORIES Elliott Wave Technical Analysis

VALUE Offer - Buy 1 Month & Get 3 Months!Click here

Access 7 Analysts Over 200 Markets Covered. Chat Room With Support

COAL-INDIA-stock-w-C...

Related

Shanghai Composite Elliott Wave Analysis: Unlock Market Trends, Predict Future Moves & Maximize Your Trading Profits!

Shanghai Composite Elliott Wave Analysis: Unlock Market Trends, Predict Future Moves & Maximize Your Trading Profits!

This Shanghai Composite Elliott Wave Analysis provides a detailed outlook on the current stock marke...

Read More >
Master Soybean Commodity Trends: Elliott Wave Technical Analysis for Precise Futures Market with Actionable Insights

Master Soybean Commodity Trends: Elliott Wave Technical Analysis for Precise Futures Market with Actionable Insights

Get a comprehensive view of soybean market trends with our detailed Elliott Wave analysis. Learn abo...

Read More >
In-Depth Elliott Wave TechnicalAnalysis for Meta Platforms Inc. (META): A Trading Perspective

In-Depth Elliott Wave TechnicalAnalysis for Meta Platforms Inc. (META): A Trading Perspective

Explore an in-depth analysis of Meta Platforms Inc. (META) through the lens of Elliott Wave theory. ...

Read More >
AUDUSD Technical Analysis: Elliott Wave Insights, Daily & 4-Hour Chart Trends, Forecasts, and Trading Strategies for 2025

AUDUSD Technical Analysis: Elliott Wave Insights, Daily & 4-Hour Chart Trends, Forecasts, and Trading Strategies for 2025

Based on Elliott Wave analysis, the Australian Dollar to US Dollar (AUDUSD) pair is undergoing a sig...

Read More >
Natural Gas Commodity Elliott Wave Technical Analysis Predicts a Continuation of the Bearish Trend in 2024 and Offers Insights

Natural Gas Commodity Elliott Wave Technical Analysis Predicts a Continuation of the Bearish Trend in 2024 and Offers Insights

This article provides a detailed analysis of the natural gas market using Elliott Wave theory. It co...

Read More >
Elliott Wave Analysis: AMZN Earnings and FOMC Signal Bullish Moves for SP500 & NASDAQ

Elliott Wave Analysis: AMZN Earnings and FOMC Signal Bullish Moves for SP500 & NASDAQ

In the recent Elliott Wave analysis, a combination of Amazon (AMZN) earnings, ADP employment figures...

Read More >

$1 for 2 Weeks

then $29 a month!

What a Special Offer!

Trade Recommendations

Unleash the power of deversified trading with our comprehensive portfolio, covering 250+ markets:

  • Stock Trades
  • Crypto Trades
  • Forex Trades
  • Commodity Trades
Elliott Wave Analysis

Gain a competitive edge with expert insights and AI-powered Elliott Wave charting into:

  • Global Indices
  • US Stocks & ASX Stocks
  • Forex & Crypto
  • Commodities
Top-Notch Trading Tools

Equip yourself with the tools of success:

  • Real-time Chat rooms
  • Elliott Wave Algorithm
  • Portfolio tools
  • TradingLevels
  • Screener
  • Trading Game
7 Elliott Wave Analysts

Stay ahead of the market with daily charts and insightful videos
Your secret to strategic trading!

JOIN HERE


Welcome to TradingLounge (ASIC A.R.No. 321187), specialists in trades, trading education and technical analysis, covering stocks, indices, commodities, forex and cryptocurrencies.

When you join TradingLounge you have access to everything we offer, including trade tools, educational content and a social platform to chat with like-minded investors.

Read more

@Copyright 2024 by tradinglounge.com

Contact Us

Australian no: 02 4787 6020

International no: +61 (2) 47876020

Pay with:

Find us on