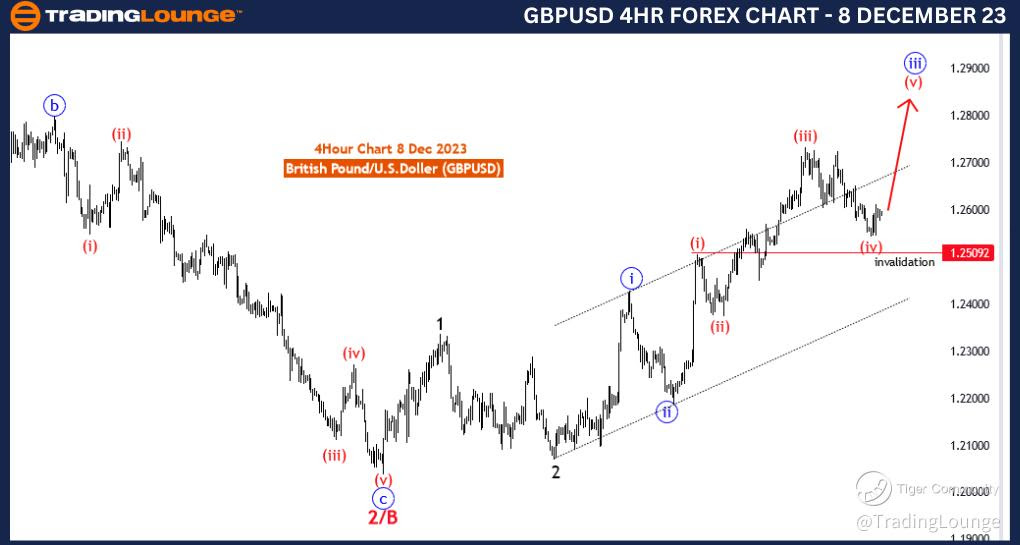
GBPUSD Elliott Wave Analysis Trading Lounge 4 Hour Chart, 8 December 23
British Pound/U.S.Dollar (GBPUSD) 4 Hour Chart
GBPUSD Elliott Wave Technical Analysis
Function: Trend
Mode: impulsive
Structure: red wave 5 of 3
Position: black wave 3
Direction;Next Higher Degrees: red wave 5(started)
Details:red wave 4 of blue wave 3 looking completed at 1.25442 Now wave red 5 of 3 is in play . Wave Cancel invalid level: 1.25092
The "GBPUSD Elliott Wave Analysis Trading Lounge 4 Hour Chart" dated 8 December 23, provides a detailed analysis of the British Pound/U.S. Dollar (GBPUSD) currency pair within a four-hour timeframe. Utilizing Elliott Wave principles, the analysis aims to offer traders insights into the current market trends, corrections, and potential future movements.
The identified "Function" of the market is labeled as "Trend," emphasizing a focus on recognizing and capitalizing on the existing directional movement. This aligns with the broader goal of understanding and trading in the direction of the prevailing trend.
The market "Mode" is characterized as "impulsive," indicating a dominant phase of strong and decisive price movements. Impulsive phases are often associated with the main trend and can present lucrative trading opportunities for those looking to ride strong directional moves.
The primary "Structure" is identified as "red wave 5 of 3," providing information about the ongoing impulsive wave within the larger Elliott Wave structure. This is crucial for traders to comprehend the current phase within the broader market context.
The specified "Position" is denoted as "black wave 3," offering insights into the current wave count within the overarching Elliott Wave sequence. Understanding the current position helps traders assess the potential risk and reward of their trades.
In terms of "Direction; Next Higher Degrees," the projection is "red wave 5 (started)," indicating that the fifth impulsive wave within the larger structure has begun. This provides a forward-looking perspective for traders preparing for potential market movements.
The "Details" section highlights that "red wave 4 of blue wave 3" is considered completed at 1.25442. This suggests the end of a corrective phase within the context of the third wave, with "red wave 5 of 3" now in play, signifying a potential resumption of the overall trend.
The "Wave Cancel invalid level" is identified as "1.25092." This level is crucial as it represents a point at which the current wave count would be invalidated, prompting a reevaluation of the prevailing market conditions.
In summary, the GBPUSD Elliott Wave Analysis for the 4 Hour Chart on 8 December 23, indicates an impulsive phase labeled as "red wave 5 of 3." The analysis provides insights into the wave structure, position, expected next wave, and a crucial level for potential wave cancellation within the broader trend. Traders can leverage this information to make informed decisions aligned with the prevailing market dynamics.
Technical Analyst: Malik Awais
Source: Tradinglounge.com get trial here!
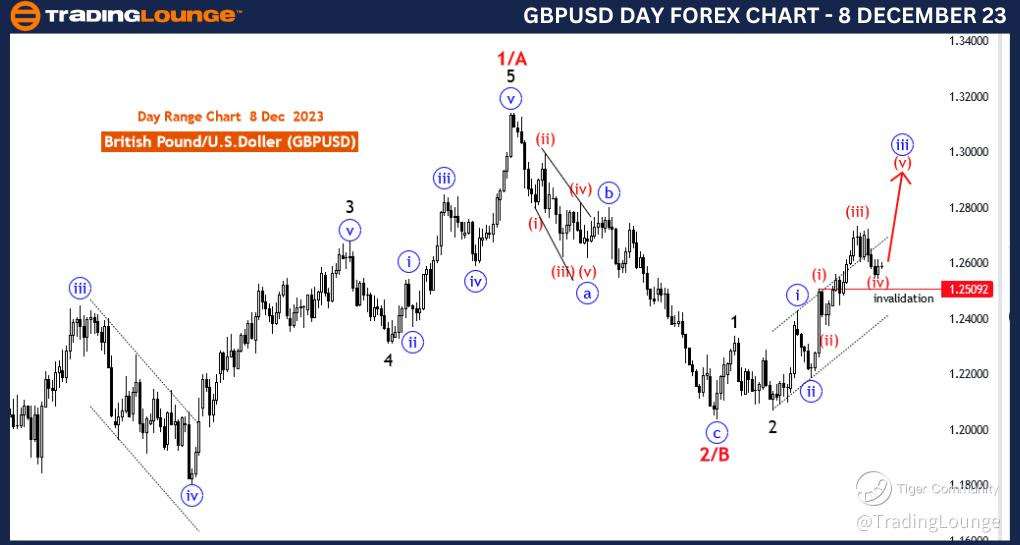
GBPUSD Elliott Wave Analysis Trading Lounge Day Chart, 8 December 23
British Pound/U.S.Dollar (GBPUSD) Day Chart
GBPUSD Elliott Wave Technical Analysis
Function: Trend
Mode: impulsive
Structure: red wave 5 of 3
Position: black wave 3
Direction;Next Higher Degrees: red wave 5(started)
Details:red wave 4 of blue wave 3 looking completed at 1.25442 Now wave red 5 of 3 is in play . Wave Cancel invalid level: 1.25092
The "GBPUSD Elliott Wave Analysis Trading Lounge Day Chart" for 8 December 23, provides an in-depth examination of the British Pound/U.S. Dollar (GBPUSD) currency pair within a daily timeframe. Employing Elliott Wave principles, the analysis aims to offer traders comprehensive insights into the current market trends, corrective phases, and potential upcoming movements.
The identified "Function" of the market is classified as a "Trend," signaling a primary focus on understanding and profiting from the existing directional movement. Recognizing and aligning with the prevailing trend is a fundamental principle in technical analysis.
The market "Mode" is characterized as "impulsive," suggesting a phase dominated by strong and decisive price movements. Impulsive phases often signify the main trend, providing traders with opportunities to capitalize on substantial directional moves.
The primary "Structure" is labeled as "red wave 5 of 3," indicating the ongoing impulsive wave within the broader Elliott Wave sequence. Understanding the structure is crucial for traders to contextualize the current phase within the larger market trend.
The specified "Position" is denoted as "black wave 3," offering insights into the current wave count within the overarching Elliott Wave framework. This knowledge assists traders in assessing the potential risks and rewards associated with their trades.
In terms of "Direction; Next Higher Degrees," the projection is "red wave 5 (started)," implying the commencement of the fifth impulsive wave within the larger Elliott Wave structure. This forward-looking perspective aids traders in preparing for potential future market movements.
The "Details" section highlights that "red wave 4 of blue wave 3" is considered completed at 1.25442. This signifies the end of a corrective phase within the context of the third wave, with "red wave 5 of 3" now in play, indicating a potential resumption of the overall trend.
The "Wave Cancel invalid level" is identified as "1.25092." This level is critical as it represents a point at which the current wave count would be invalidated, prompting a reassessment of the prevailing market conditions.
In summary, the GBPUSD Elliott Wave Analysis for the Day Chart on 8 December 23, indicates an impulsive phase labeled as "red wave 5 of 3." The analysis provides insights into the wave structure, position, expected next wave, and a crucial level for potential wave cancellation within the broader trend. Traders can leverage this information to make informed decisions aligned with the prevailing market dynamics.
Technical Analyst: Malik Awais
Source: Tradinglounge.com get trial here!