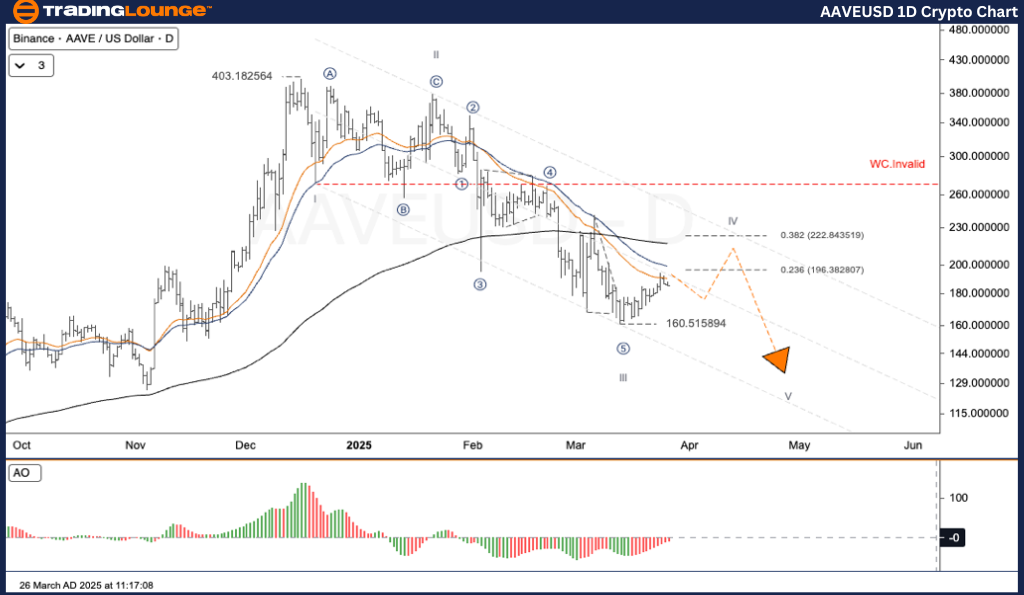
AAVEUSD Elliott Wave Analysis – TradingLounge Daily Chart

AAVE / U.S. Dollar (AAVEUSD) Daily Chart Analysis

AAVEUSD Elliott Wave Technical Analysis

Function: Follow Trend

Mode: Motive

Structure: Impulse

Position: Wave III

Direction Next Higher Degrees:

Wave Cancel Invalid Level:

AAVEUSD Trading Strategy – Daily Timeframe

AAVE is currently trending lower, consistent with its Elliott Wave pattern. The price action indicates a wave IV retracement, setting up for a possible wave V downward continuation. This phase may present trade setups for those targeting a reversal or looking to maintain short positions. Wave III concluded at 160.51, and wave IV is now unfolding with expectations of a near-term reversal.

Fibonacci Retracement Levels:

  • 23.6% at 196.35
  • 38.2% at 222.78

Trading Strategies

Strategy: Short-Term Traders (Swing Trade)

  • ✅ If AAVE approaches the upper Fibonacci resistance zone and reverses, it may mark the start of wave V, potentially pushing the price below 150, possibly towards 120.

Risk Management Tip:

  • If AAVE/USD breaks above 289.00, this would invalidate the current Elliott Wave count, requiring a reassessment of the structure.

AAVEUSD-1D-Crypto-Ch...


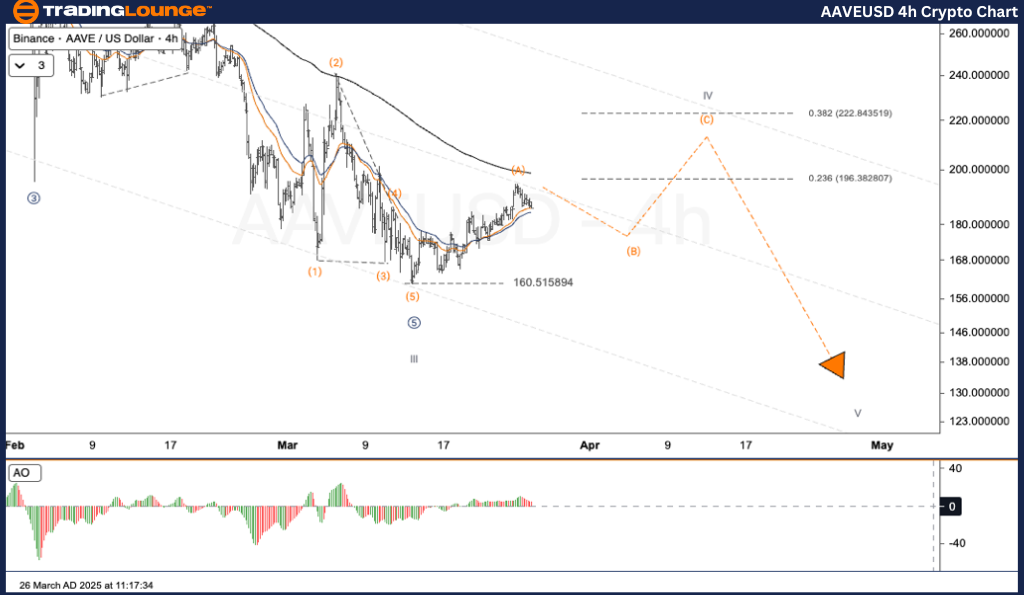
AAVEUSD Elliott Wave Analysis – TradingLounge H4 Chart

AAVE / U.S. Dollar (AAVEUSD) 4-hour Chart Analysis

AAVEUSD Elliott Wave Technical Analysis

Function: Follow Trend

Mode: Motive

Structure: Impulse

Position: Wave II

Direction Next Higher Degrees: —

Wave Cancel Invalid Level: —

AAVEUSD Trading Strategy – 4-Hour Timeframe

On the H4 chart, AAVE remains in a corrective move, identified as a wave IV pullback in the Elliott Wave structure. This retracement could precede a fresh decline in wave V. Wave III ended at 160.51, with the current wave IV presenting potential opportunities for reversal trades or further downside setups.

Fibonacci Retracement Levels:

  • 23.6% at 196.35
  • 38.2% at 222.78

Trading Strategies

Strategy: Short-Term Traders (Swing Trade)

  • ✅ Watch for AAVE nearing the Fibonacci resistance and then turning downward. This move could lead to wave V extending to levels below 150, possibly targeting 120.

Risk Management Tip:

  • A move above 289.00 would invalidate the existing wave count and prompt a reevaluation.

Technical Analyst: Kittiampon Somboonsod

Source: Visit Tradinglounge.com and learn from the Experts. Join TradingLounge Here 

Previous: BTCUSD Elliott Wave Technical Analysis

VALUE Offer - Buy 1 Month & Get 3 Months!Click here

Access 7 Analysts Over 200 Markets Covered. Chat Room With Support

AAVEUSD-4h-Crypto-Ch...

Related

ASX FPH Stock Analysis: Fisher & Paykel Healthcare Elliott Wave Forecast, Wave 4 Triangle Pattern, and Price Prediction Insights

ASX FPH Stock Analysis: Fisher & Paykel Healthcare Elliott Wave Forecast, Wave 4 Triangle Pattern, and Price Prediction Insights

Elliott Wave analysis for ASX: FPH (Fisher & Paykel Healthcare Corporation Limited). Our technical a...

Read More >
In-Depth Kotak Bank Elliott Wave Analysis Reveals Key Market Trends and Potential Price Movements for Strategic Trading Decisions

In-Depth Kotak Bank Elliott Wave Analysis Reveals Key Market Trends and Potential Price Movements for Strategic Trading Decisions

This analysis delves into Kotak Bank's stock behaviour using Elliott Wave theory, highlighting c...

Read More >
Spotify Technology S.A. Stocks Elliott Wave Technical Analysis: Evaluate Current Trends and Forecast SPOT’s Future Price Direction

Spotify Technology S.A. Stocks Elliott Wave Technical Analysis: Evaluate Current Trends and Forecast SPOT’s Future Price Direction

This in-depth Spotify stock analysis applies Elliott Wave Theory to evaluate current trends and fore...

Read More >
Article provides an in-depth Silver (XAGUSD) Commodity Elliott Wave Technical Analysis

Article provides an in-depth Silver (XAGUSD) Commodity Elliott Wave Technical Analysis

This article provides an in-depth Silver Price Analysis through the lens of Elliott Wave Theory. It ...

Read More >
Look at ASX LIMITED on the Australian Stock Exchange: ASX Stock Analysis & Elliott Wave Technical Forecast

Look at ASX LIMITED on the Australian Stock Exchange: ASX Stock Analysis & Elliott Wave Technical Forecast

Our Elliott Wave analysis provides an in-depth look at ASX LIMITED on the Australian Stock Exchange....

Read More >

$1 for 2 Weeks

then $29 a month!

What a Special Offer!

Trade Recommendations

Unleash the power of deversified trading with our comprehensive portfolio, covering 250+ markets:

  • Stock Trades
  • Crypto Trades
  • Forex Trades
  • Commodity Trades
Elliott Wave Analysis

Gain a competitive edge with expert insights and AI-powered Elliott Wave charting into:

  • Global Indices
  • US Stocks & ASX Stocks
  • Forex & Crypto
  • Commodities
Top-Notch Trading Tools

Equip yourself with the tools of success:

  • Real-time Chat rooms
  • Elliott Wave Algorithm
  • Portfolio tools
  • TradingLevels
  • Screener
  • Trading Game
7 Elliott Wave Analysts

Stay ahead of the market with daily charts and insightful videos
Your secret to strategic trading!

JOIN HERE


Welcome to TradingLounge (ASIC A.R.No. 321187), specialists in trades, trading education and technical analysis, covering stocks, indices, commodities, forex and cryptocurrencies.

When you join TradingLounge you have access to everything we offer, including trade tools, educational content and a social platform to chat with like-minded investors.

Read more

@Copyright 2024 by tradinglounge.com

Contact Us

Australian no: 02 4787 6020

International no: +61 (2) 47876020

Pay with:

Find us on