20Feb

Market dynamics: Microsoft Inc.(MSFT) Elliott Wave Technical Analysis Insights

MSFT Elliott Wave Analysis Trading Lounge Daily Chart, 20 February 24

Welcome to our MSFT Elliott Wave Analysis Trading Lounge, your ultimate destination for comprehensive insights into Microsoft Inc. (MSFT) using Elliott Wave Technical Analysis. As of the Daily Chart on 20th February 2024, we delve into significant trends guiding the market.

MSFT Elliott Wave Technical Analysis 

Microsoft Inc., (MSFT) Daily Chart

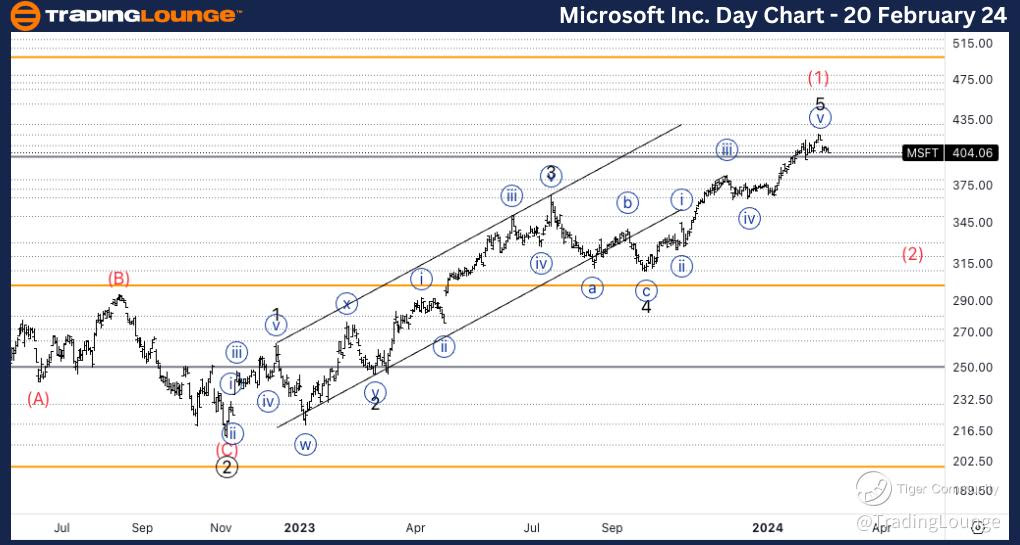
Embarking on a detailed Elliott Wave technical analysis of Microsoft Inc. (MSFT), we delve into the intricacies of its current market trends. The observed functionality suggests a counter-trend trajectory within a corrective mode characterized by a zigzag structure. Presently, the stock is positioned at Minor Wave 5 of (1), manifesting a downside trajectory within Wave A of (2).

In the wake of an impressive rally resembling wave (1), indications point towards the conclusion or imminent termination of this upward movement. A distinct five-wave pattern substantiates this perspective, complemented by discernible resistance encountered around the Medium Level of $400.

MSFT-day-stock-chart...


MSFT Elliott Wave Analysis Trading Lounge 4Hr Chart, 20 February 24

Microsoft Inc., , (MSFT) 4Hr Chart

Microsoft Inc. Elliott Wave Technical Analysis

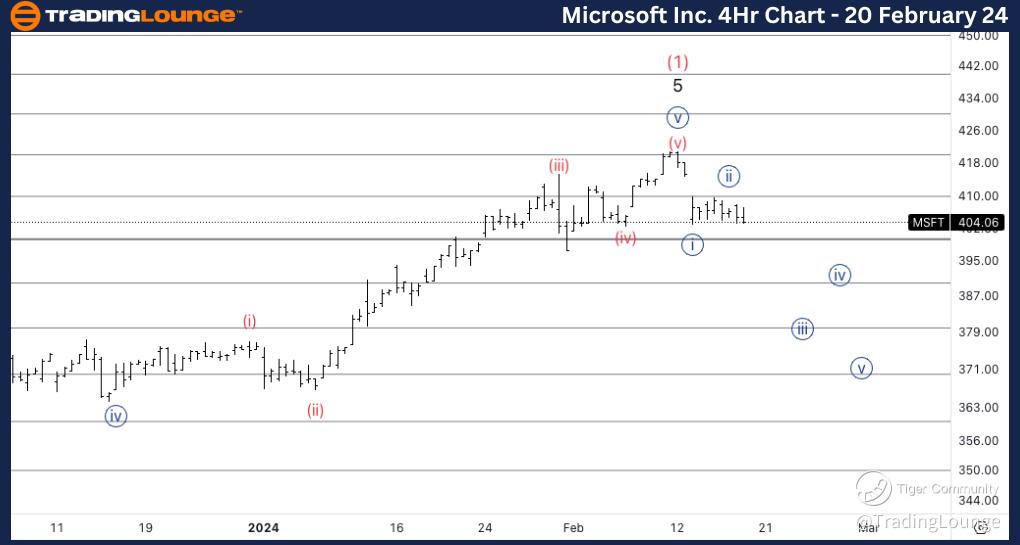
The 4-hour chart for Microsoft Inc., (MSFT) continues to unravel noteworthy insights through an Elliott Wave technical analysis. The prevailing market dynamics reveal a counter-trend scenario operating within a corrective mode, characterized by a zigzag structure. The current positioning is identified as Wave {i} of A, signifying a continuation lower into the impending wave {iii}.

A meticulous examination of recent price action unveils a corrective pullback marked as wave {ii}, hinting at a probable descent in the forthcoming wave {iii}. Anticipating further downside, our focus is set on the target within wave A, aligning with the previous wave {iv}, pinpointed at the $370 mark.

Technical Analyst: Alessio Barretta

Source: visit Tradinglounge.com and learn From the Experts Join TradingLounge Here 

See Previous:  META Platforms Inc. (META)

MSFT-4h-stock-chart-...

In summary, the Elliott Wave analysis for MSFT on both the daily and 4-hour charts signals a prevailing counter-trend sentiment, governed by a corrective mode typified by zigzag structures. The nuanced wave counts and distinctive patterns suggest an impending downside trajectory, with the daily chart pointing towards Minor wave 5 of (1) and the 4-hour chart indicating the continuation of Wave {iii} within the corrective sequence. Investors and traders are advised to remain vigilant, considering the potential developments in line with the outlined Elliott Wave framework for MSFT.

Related

Analog Devices Inc.(ADI:NASDAQ) Elliott Wave Technical Analysis 29 November 23

Analog Devices Inc.(ADI:NASDAQ) Elliott Wave Technical Analysis 29 November 23

Analog Devices Inc.(ADI: NASDAQ) Elliott Wave Technical Analysis dated 29 November 23, Analog Device...

Read More >
Wheat Commodity Elliott Wave Technical Analysis: Detailed Forecast for Prices and Key Trading Strategies Based on Market Patterns

Wheat Commodity Elliott Wave Technical Analysis: Detailed Forecast for Prices and Key Trading Strategies Based on Market Patterns

This analysis provides insights into the current wheat market using Elliott Wave theory. It reviews ...

Read More >
Soybeans Elliott Wave Technical Analysis: Assessing Current Impulse and Future Trends

Soybeans Elliott Wave Technical Analysis: Assessing Current Impulse and Future Trends

This article provides an in-depth Elliott Wave analysis of the soybean market. It covers the ongoing...

Read More >
Corn Commodity Elliott Wave Technical Analysis: Market Outlook for Precise Trading Decisions

Corn Commodity Elliott Wave Technical Analysis: Market Outlook for Precise Trading Decisions

Corn futures continue to follow a bearish Elliott Wave pattern, with key resistance at 504.5 and pot...

Read More >
USDCHF Forex Elliott Wave Analysis: U.S. Dollar / Swiss Franc Currency Pair Technical Insights and Trading Strategies

USDCHF Forex Elliott Wave Analysis: U.S. Dollar / Swiss Franc Currency Pair Technical Insights and Trading Strategies

The USDCHF Elliott Wave analysis highlights bullish trends on daily and 4-hour charts. Orange wave 5...

Read More >
Explore CBA's stock performance: Elliott Wave forecast for the Commonwealth Bank of Australia (CBA) on the ASX

Explore CBA's stock performance: Elliott Wave forecast for the Commonwealth Bank of Australia (CBA) on the ASX

This analysis provides an in-depth Elliott Wave forecast for the Commonwealth Bank of Australia (CBA...

Read More >

$1 for 2 Weeks

then $29 a month!

What a Special Offer!

Trade Recommendations

Unleash the power of deversified trading with our comprehensive portfolio, covering 250+ markets:

  • Stock Trades
  • Crypto Trades
  • Forex Trades
  • Commodity Trades
Elliott Wave Analysis

Gain a competitive edge with expert insights and AI-powered Elliott Wave charting into:

  • Global Indices
  • US Stocks & ASX Stocks
  • Forex & Crypto
  • Commodities
Top-Notch Trading Tools

Equip yourself with the tools of success:

  • Real-time Chat rooms
  • Elliott Wave Algorithm
  • Portfolio tools
  • TradingLevels
  • Screener
  • Trading Game
7 Elliott Wave Analysts

Stay ahead of the market with daily charts and insightful videos
Your secret to strategic trading!

JOIN HERE


Welcome to TradingLounge (ASIC A.R.No. 321187), specialists in trades, trading education and technical analysis, covering stocks, indices, commodities, forex and cryptocurrencies.

When you join TradingLounge you have access to everything we offer, including trade tools, educational content and a social platform to chat with like-minded investors.

Read more

@Copyright 2024 by tradinglounge.com

Contact Us

Australian no: 02 4787 6020

International no: +61 (2) 47876020

Pay with:

Find us on