27Feb

WTI Crudeoil Elliott Wave Analysis: Crude Oil Price Forecast, Support & Resistance Levels, and Trading Strategy Insights

WTI Elliott Wave Analysis: Market Trends & Forecasts

WTI crude oil continues its downward momentum from January 2025, following a corrective bounce in September 2024, when prices briefly surged above $65. The broader market trend indicates a sideways price action, forming a consolidation phase. As WTI approaches the lower boundary of this range, a potential rebound may be on the horizon.


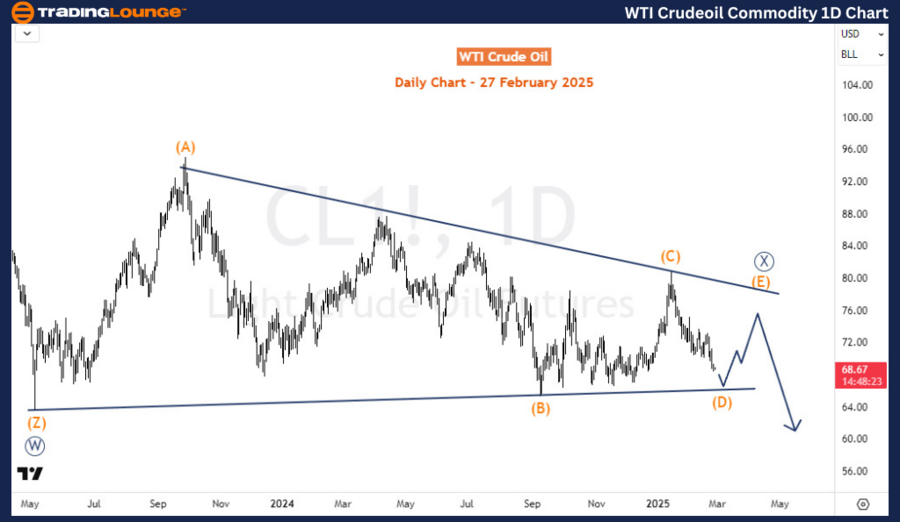
WTI Crudeoil  Daily Chart Analysis: Triangle Structure in Play

The daily chart highlights a triangle consolidation pattern that emerged in May 2023, following a steep sell-off from the $131 peak in March 2022, at the height of the Russia-Ukraine conflict.

  • The March 2022 - May 2023 decline is classified as a zigzag/double zigzag correction, labeled as wave ((W)).
  • The sideways price movement from May 2023 remains incomplete, forming wave ((X)).
  • Once wave ((X)) concludes, WTI prices could decline further, possibly falling below $50, completing the bearish corrective cycle initiated in March 2022.

WTI-Crudeoil-Commodi...


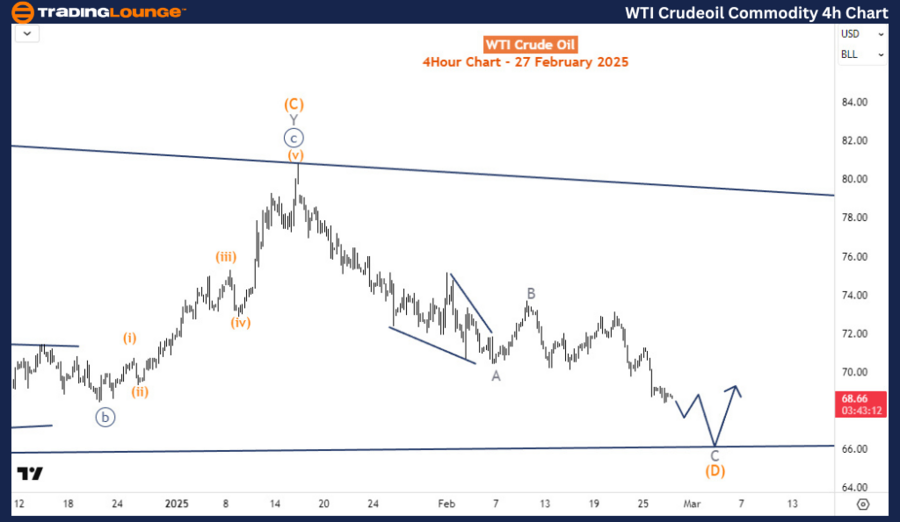
WTI Crudeoil H4 Chart Analysis: Final Stages of Triangle Pattern

The H4 chart suggests that WTI is in the last stages of the triangle formation for wave ((X)). The price action is currently positioned within wave (D) of ((X)), extending from the January 2025 high.

  • Wave C of (D) is still in progress and could push WTI toward $66 before a bounce occurs for wave (E).
  • If WTI drops below $65.25, the triangle structure would be invalidated.
  • In such a case, prices could retreat further to the $61.85 - $54.59 range, indicating stronger bearish pressure.

This Elliott Wave outlook helps traders assess critical support and resistance zones for strategic decision-making.

Technical Analyst: Sanmi Adeagbo

Source: visit Tradinglounge.com and learn From the Experts Join TradingLounge Here 

See Previous: Silver (XAGUSD) Elliott Wave Technical Analysis

VALUE Offer - Buy 1 Month & Get 3 Months!Click here

Access 7 Analysts Over 200 Markets Covered. Chat Room With Support

WTI-Crudeoil-Commodi...

Related

BHARAT ELECTRONICS (BEL) Elliott Wave Analysis: Daily & Weekly Chart Forecast, Wave 4 Correction, and Bullish Trend Strategy

BHARAT ELECTRONICS (BEL) Elliott Wave Analysis: Daily & Weekly Chart Forecast, Wave 4 Correction, and Bullish Trend Strategy

Elliott Wave analysis of Bharat Electronics (BEL) stock, covering both daily and weekly charts. It h...

Read More >
SPDR Financial Sector ETF (XLF) Elliott Wave Forecast: Bullish Impulse Wave, Support Levels, and Price Target Above $54 for ETF Traders

SPDR Financial Sector ETF (XLF) Elliott Wave Forecast: Bullish Impulse Wave, Support Levels, and Price Target Above $54 for ETF Traders

This analysis breaks down the current Elliott Wave structure of the SPDR Financial Sector ETF (XLF),...

Read More >
Thoroughly Analyses the CAC 40, Featuring Elliott Wave Insights, Technical Analysis, and Forecasts: CAC 40 Trading Strategies

Thoroughly Analyses the CAC 40, Featuring Elliott Wave Insights, Technical Analysis, and Forecasts: CAC 40 Trading Strategies

This article thoroughly analyses the CAC 40, featuring Elliott Wave insights, technical analysis, an...

Read More >
Larsen & Toubro Stock Elliott Wave Technical Analysis: Covering Current Trends, Wave Counts, and Potential Price targets

Larsen & Toubro Stock Elliott Wave Technical Analysis: Covering Current Trends, Wave Counts, and Potential Price targets

This analysis provides a comprehensive Elliott Wave review of Larsen & Toubro (LT) stock, covering c...

Read More >
Ethereum Elliott Wave Technical Analysis: Detailed Technical Insights, Fibonacci Levels and Trading Strategies for ETH/USD

Ethereum Elliott Wave Technical Analysis: Detailed Technical Insights, Fibonacci Levels and Trading Strategies for ETH/USD

Ethereum's (ETH/USD) Elliott Wave analysis, provides insights into corrective patterns, key Fibo...

Read More >
Comprehensive AUDUSD Elliott Wave Forecast: Daily Bullish Impulse & 4‑Hour Corrective Wave Insight for Traders

Comprehensive AUDUSD Elliott Wave Forecast: Daily Bullish Impulse & 4‑Hour Corrective Wave Insight for Traders

Comprehensive AUDUSD Elliott Wave analysis outlining bullish impulsive structure on the daily chart ...

Read More >

$1 for 2 Weeks

then $29 a month!

What a Special Offer!

Trade Recommendations

Unleash the power of deversified trading with our comprehensive portfolio, covering 250+ markets:

  • Stock Trades
  • Crypto Trades
  • Forex Trades
  • Commodity Trades
Elliott Wave Analysis

Gain a competitive edge with expert insights and AI-powered Elliott Wave charting into:

  • Global Indices
  • US Stocks & ASX Stocks
  • Forex & Crypto
  • Commodities
Top-Notch Trading Tools

Equip yourself with the tools of success:

  • Real-time Chat rooms
  • Elliott Wave Algorithm
  • Portfolio tools
  • TradingLevels
  • Screener
  • Trading Game
7 Elliott Wave Analysts

Stay ahead of the market with daily charts and insightful videos
Your secret to strategic trading!

JOIN HERE


Welcome to TradingLounge (ASIC A.R.No. 321187), specialists in trades, trading education and technical analysis, covering stocks, indices, commodities, forex and cryptocurrencies.

When you join TradingLounge you have access to everything we offer, including trade tools, educational content and a social platform to chat with like-minded investors.

Read more

@Copyright 2024 by tradinglounge.com

Contact Us

Australian no: 02 4787 6020

International no: +61 (2) 47876020

Pay with:

Find us on