06Jun

Dr Reddy Laboratories Share Forecast and Elliott Wave Analysis Signals Bullish Trend, Buy Zones, and Key Price Levels for Traders

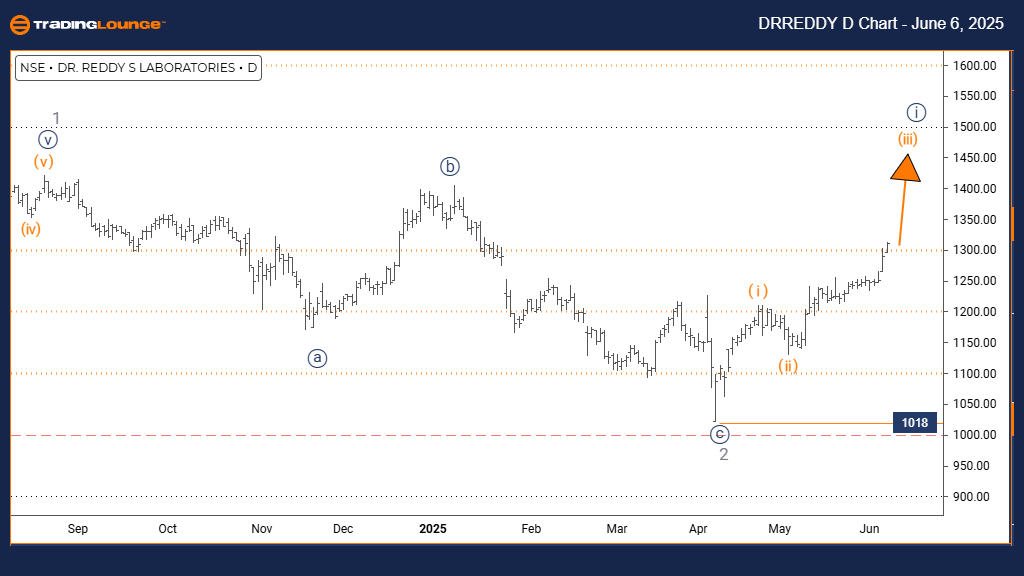
DR REDDY LABORATORIES Elliott Wave Analysis – Trading Lounge Day Chart

DR REDDY LABORATORIES Day Chart Analysis

DR REDDY LABORATORIES Elliott Wave Technical Analysis

FUNCTION: Bullish Trend

MODE: Impulsive

STRUCTURE: Orange Wave 3

POSITION: Navy Blue Wave 1

DIRECTION NEXT LOWER DEGREES: Orange Wave 4

DETAILS: Completion of Orange Wave 2; progression of Orange Wave 3 underway.

Wave Cancel Invalidation Level: 1018

The daily Elliott Wave analysis for Dr Reddy Laboratories stock indicates a strong bullish trend, with the current price movement forming an impulsive wave structure. The chart reveals the unfolding of orange wave 3, positioned within a larger navy blue wave 1 cycle—suggesting continued upward momentum.

Following the confirmed end of orange wave 2, the market is now advancing through orange wave 3, typically characterized by robust price action in Elliott Wave patterns. While a temporary correction in orange wave 4 may follow, the overall trend remains bullish. Traders should note the invalidation level at 1018—a decline below this price would negate the current wave scenario.

Key Takeaways:

  • Impulsive wave action reflects a dominant bullish market sentiment.
  • Active monitoring of wave progression is essential.
  • Maintain bullish bias above the 1018 support threshold.

DRREDDY-D-Stock-Char...


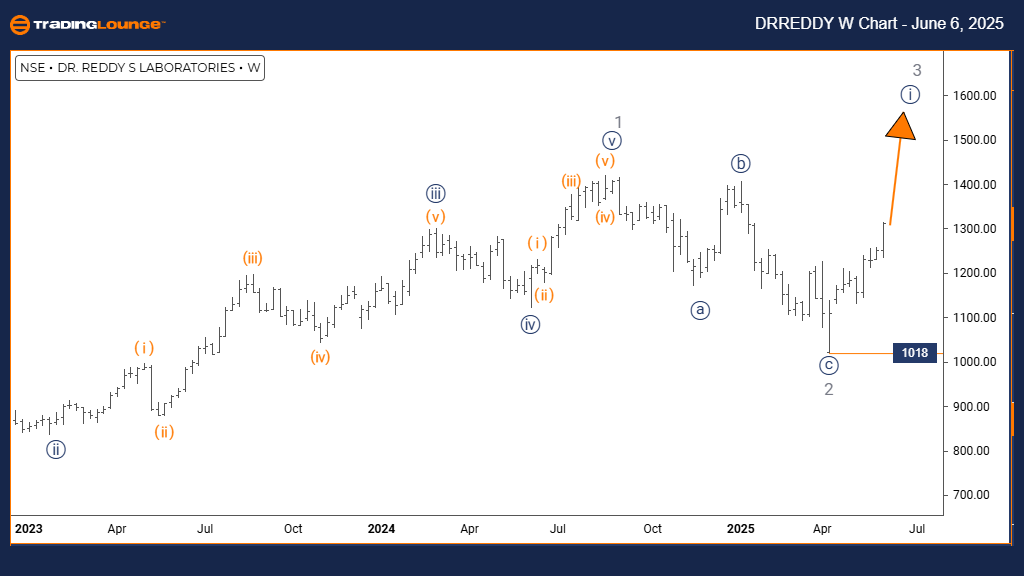
DR REDDY LABORATORIES Elliott Wave Analysis – Trading Lounge Weekly Chart

DR REDDY LABORATORIES Elliott Wave Technical Analysis

FUNCTION: Bullish Trend

MODE: Impulsive

STRUCTURE: Navy Blue Wave 1

POSITION: Gray Wave 3

DIRECTION NEXT HIGHER DEGREES: Navy Blue Wave 1 (initiated)

DETAILS: Completion of Gray Wave 2; Navy Blue Wave 1 advancing within Gray Wave 3.

Wave Cancel Invalidation Level: 1018

On the weekly timeframe, Dr Reddy Laboratories shares are confirming a bullish Elliott Wave structure. The movement reflects an active navy blue wave 1, which is unfolding as part of a broader gray wave 3. This configuration supports a medium- to long-term bullish outlook.

With gray wave 2 completed, the current action within navy blue wave 1 suggests growing market strength. The beginning of the next navy blue wave 1 phase within gray wave 3 signals sustained upside momentum. If price levels fall beneath 1018, this would invalidate the existing wave structure.

Technical Analyst: Malik Awais

Source: Visit Tradinglounge.com and learn from the Experts. Join TradingLounge Here 

Previous: GRASIM INDUSTRIES Elliott Wave Technical Analysis

VALUE Offer - Buy 1 Month & Get 3 Months!Click here

Access 7 Analysts Over 200 Markets Covered. Chat Room With Support

DRREDDY-w-Stock-Char...

Related

XRPUSD Elliott Wave Technical Analysis: XRP Price Prediction, Trading Strategy, and Technical Indicators

XRPUSD Elliott Wave Technical Analysis: XRP Price Prediction, Trading Strategy, and Technical Indicators

This article provides a comprehensive XRPUSD Elliott Wave analysis, highlighting the price predictio...

Read More >
Wheat Commodity Elliott Wave Technical Analysis: Bullish Corrections and Future Price Movements in Wheat Futures

Wheat Commodity Elliott Wave Technical Analysis: Bullish Corrections and Future Price Movements in Wheat Futures

Our latest wheat price forecast for 2024 is based on Elliott Wave analysis, highlighting key market ...

Read More >
Uniswap (UNIUSD) Elliott Wave Technical Analysis & price predictions, market trends, and trading strategies.

Uniswap (UNIUSD) Elliott Wave Technical Analysis & price predictions, market trends, and trading strategies.

This article provides an in-depth Elliott Wave analysis of Uniswap (UNIUSD), offering insights into ...

Read More >
Ethereum Elliott Wave Analysis: Forecasting ETHUSD Movements with Key Wave Patterns and Strategic Trading Insights

Ethereum Elliott Wave Analysis: Forecasting ETHUSD Movements with Key Wave Patterns and Strategic Trading Insights

This article provides an in-depth Ethereum Elliott Wave Analysis, focusing on the ETHUSD pair. It ex...

Read More >
BTCUSD Elliott Wave Technical Analysis: Is Bitcoin on the Verge of a Massive Breakout? Key Price Levels & Trading Strategy!

BTCUSD Elliott Wave Technical Analysis: Is Bitcoin on the Verge of a Massive Breakout? Key Price Levels & Trading Strategy!

This BTCUSD Elliott Wave analysis provides a detailed breakdown of Bitcoin price trends, key support...

Read More >
S&P 500 ELLIOTT WAVE ANALYSIS, 27 JAN 2022

S&P 500 ELLIOTT WAVE ANALYSIS, 27 JAN 2022

S&P500 Overview: The 4100 is the 38.2% retracement level for the SP500. Trading Strategies: Hold sho...

Read More >

$1 for 2 Weeks

then $29 a month!

What a Special Offer!

Trade Recommendations

Unleash the power of deversified trading with our comprehensive portfolio, covering 250+ markets:

  • Stock Trades
  • Crypto Trades
  • Forex Trades
  • Commodity Trades
Elliott Wave Analysis

Gain a competitive edge with expert insights and AI-powered Elliott Wave charting into:

  • Global Indices
  • US Stocks & ASX Stocks
  • Forex & Crypto
  • Commodities
Top-Notch Trading Tools

Equip yourself with the tools of success:

  • Real-time Chat rooms
  • Elliott Wave Algorithm
  • Portfolio tools
  • TradingLevels
  • Screener
  • Trading Game
7 Elliott Wave Analysts

Stay ahead of the market with daily charts and insightful videos
Your secret to strategic trading!

JOIN HERE


Welcome to TradingLounge (ASIC A.R.No. 321187), specialists in trades, trading education and technical analysis, covering stocks, indices, commodities, forex and cryptocurrencies.

When you join TradingLounge you have access to everything we offer, including trade tools, educational content and a social platform to chat with like-minded investors.

Read more

@Copyright 2024 by tradinglounge.com

Contact Us

Australian no: 02 4787 6020

International no: +61 (2) 47876020

Pay with:

Find us on