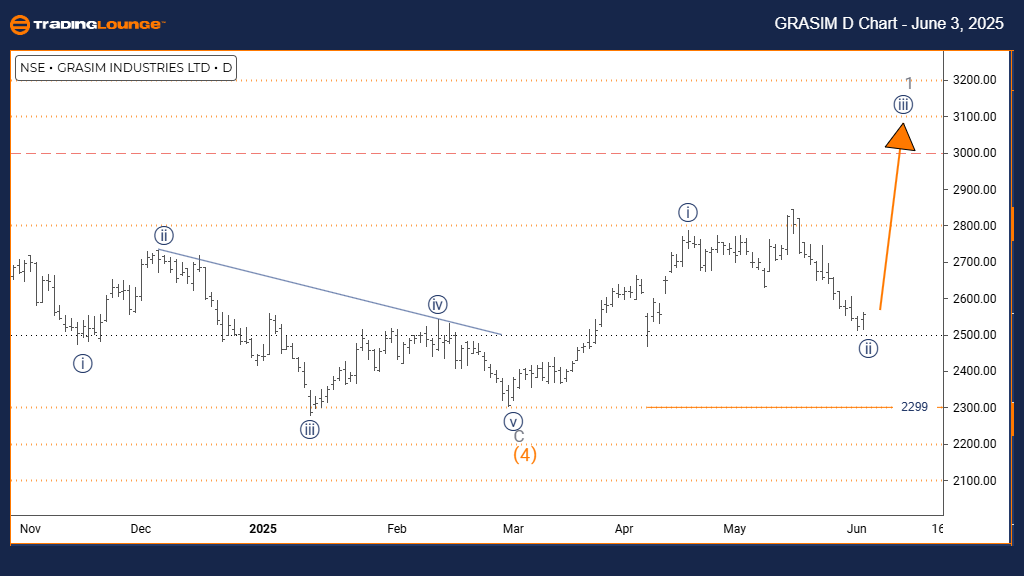
GRASIM INDUSTRIES Elliott Wave Analysis Trading Lounge Day Chart
GRASIM INDUSTRIES Stock Day Chart Analysis
GRASIM INDUSTRIES Elliott Wave Technical Analysis
FUNCTION: Trend
MODE: Impulsive
STRUCTURE: Navy blue wave 3
POSITION: Gray wave 1
DIRECTION NEXT HIGHER DEGREES: Navy blue wave 3 (active)
DETAILS: Completion of navy blue wave 2 confirmed; navy blue wave 3 of 1 is currently developing.
Cancel Invalid Level: 2299
The daily Elliott Wave chart for Grasim Industries displays robust bullish momentum within a clearly defined uptrend. Currently, navy blue wave three is evolving within the larger framework of gray wave one, indicating that the corrective navy blue wave two has ended. This transition marks the beginning of what is typically the strongest segment of an Elliott Wave impulse pattern.
The confirmation of navy blue wave two's completion supports the development of wave three, which is generally characterized by increased bullish momentum and higher trading volume. With the price structure situated in gray wave one, upside potential remains significant. Key technical support lies at 2299, serving as a crucial invalidation level. A price drop below this level would negate the current bullish wave scenario.
This Elliott Wave analysis for Grasim Industries offers traders and investors a structured outlook, suggesting a potentially strong rally phase as navy blue wave three progresses. Continued upward movement is anticipated as long as the stock price remains above the 2299 support.
Market participants are advised to monitor wave three's price action closely for confirmation of sustained strength. Any weakness below 2299 should prompt a reassessment of the wave count and overall trend direction.
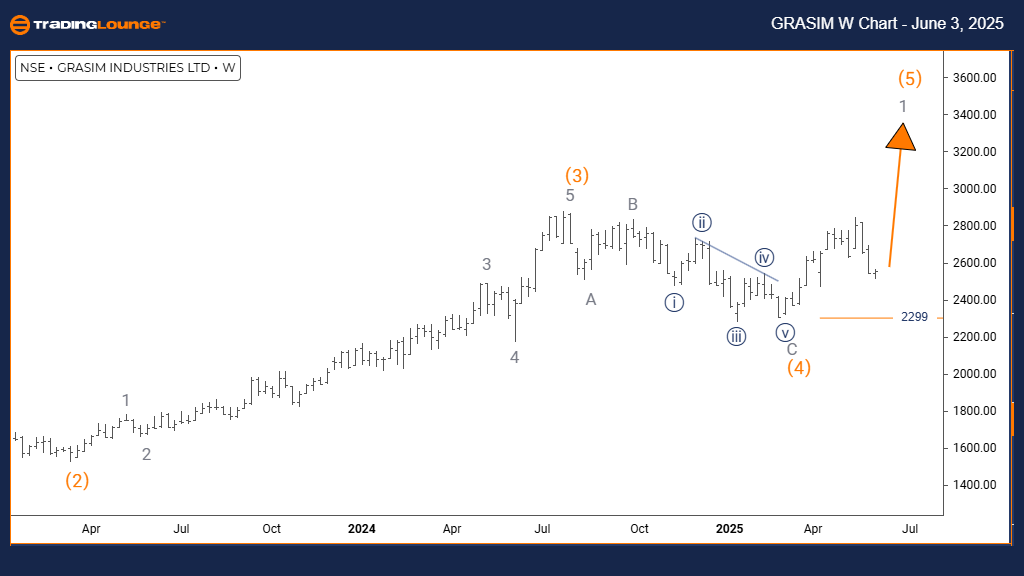
GRASIM INDUSTRIES Elliott Wave Analysis Trading Lounge Weekly Chart
GRASIM INDUSTRIES Elliott Wave Technical Analysis
FUNCTION: Trend
MODE: Impulsive
STRUCTURE: Gray wave 1
POSITION: Orange wave 5
DIRECTION NEXT LOWER DEGREES: Gray wave 2
DETAILS: Completion of orange wave 4 observed; gray wave 1 of 5 is currently unfolding.
Cancel Invalid Level: 2299
The weekly Elliott Wave chart of Grasim Industries indicates the approach of the final impulsive phase within a broader bullish structure. The ongoing formation of gray wave one is part of orange wave five, suggesting that orange wave four has finalized and the stock has entered the last bullish leg of this cycle.
With the transition into gray wave one, continued upward price action is expected. However, as this is potentially the final wave in the current five-wave structure, caution is warranted. The 2299 invalidation level remains pivotal for maintaining the bullish perspective; a breach of this support would challenge the current wave interpretation and may imply a broader correction.
This technical forecast for Grasim Industries gives investors insight into where the stock stands within its long-term Elliott Wave cycle. A final upward surge may occur before a more substantial retracement phase. At this point in the cycle, it’s important to apply risk management strategies and stay alert for signs of trend exhaustion.
Investors should look out for divergence in technical indicators or reduced upward momentum, which are often associated with the maturing phase of a fifth wave. While the broader outlook stays positive, vigilance is essential as this Elliott Wave structure nears its end.
Technical Analyst: Malik Awais
Source: Visit Tradinglounge.com and learn from the Experts. Join TradingLounge Here
Previous: KOTAK BANK Elliott Wave Technical Analysis
VALUE Offer - Buy 1 Month & Get 3 Months!Click here
Access 7 Analysts Over 200 Markets Covered. Chat Room With Support