30May

In-Depth Kotak Bank Elliott Wave Analysis Reveals Key Market Trends and Potential Price Movements for Strategic Trading Decisions

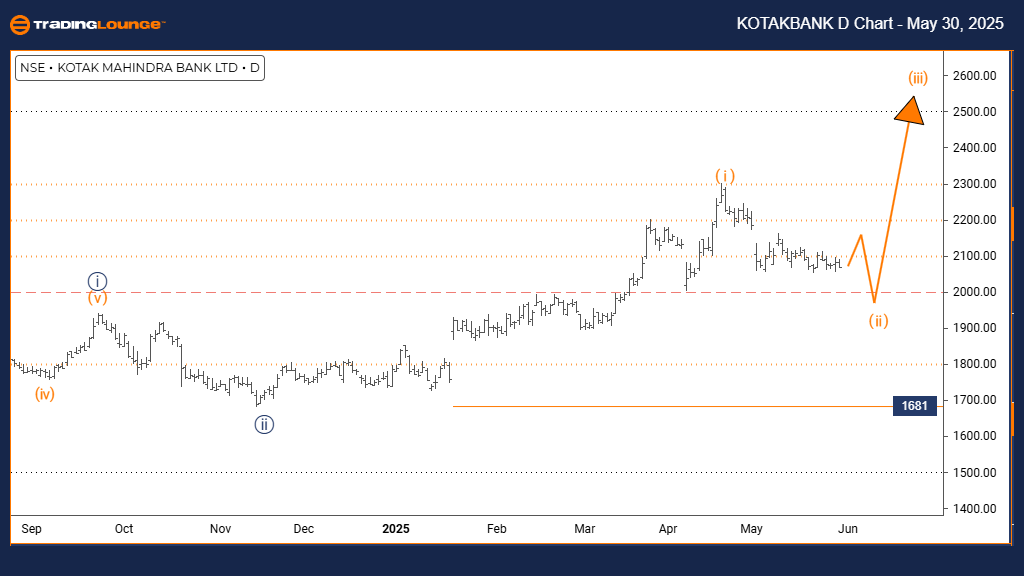
KOTAK BANK Elliott Wave Analysis – Trading Lounge Day Chart

Kotak Bank Day Chart Analysis

KOTAK BANK Elliott Wave Technical Analysis

FUNCTION: Counter Trend

MODE: Corrective

STRUCTURE: Orange Wave 2

POSITION: Navy Blue Wave 3

DIRECTION NEXT HIGHER DEGREES: Orange Wave 3

DETAILS: Orange Wave 1 has completed, and Orange Wave 2 is currently forming.
Wave Invalidation Level: 1681

The daily Elliott Wave chart for Kotak Bank shows the stock in a corrective counter-trend pattern, part of a broader bearish sequence under Navy Blue Wave 3. The ongoing development of Orange Wave 2 follows the completion of the downward Orange Wave 1, indicating a temporary pause in the primary downtrend.

This corrective phase suggests a limited upside as the market adjusts within Orange Wave 2. Should the price exceed 1681, the current Elliott Wave structure would be invalidated, signaling a potential trend reversal or a more complex correction.

Key Takeaways:

  • Kotak Bank is undergoing a corrective phase.
  • Wave 2 upside potential appears restricted.
  • Monitoring 1681 as the invalidation level is crucial.
  • Completion of Wave 2 may resume the broader bearish move (Wave 3).

KOTAK-BANK-Day-Chart...


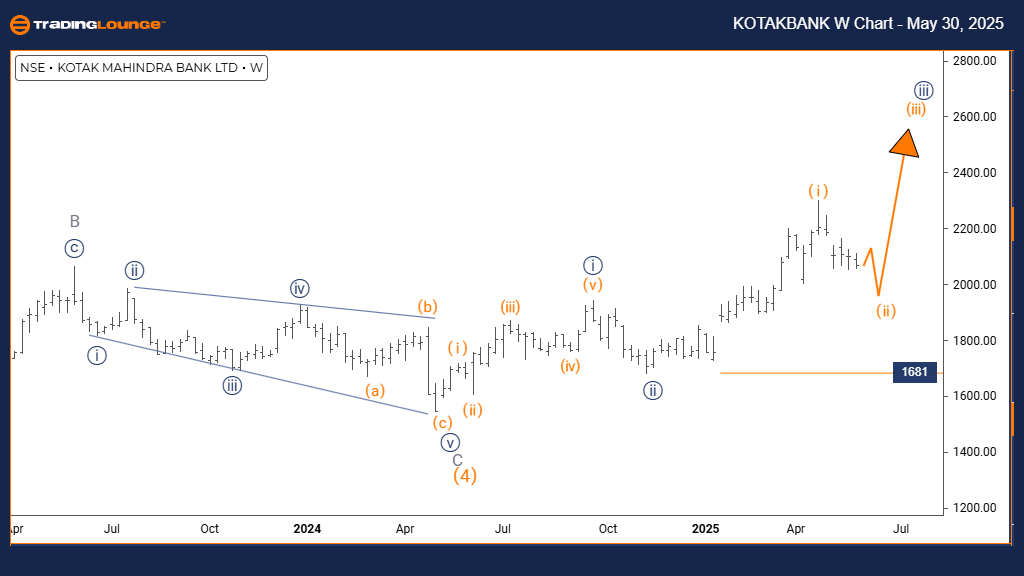
KOTAK BANK Elliott Wave Analysis – Trading Lounge Weekly Chart

KOTAK BANK Elliott Wave Technical Analysis

FUNCTION: Counter Trend

MODE: Corrective

STRUCTURE: Orange Wave 2

POSITION: Navy Blue Wave 3

DIRECTION NEXT HIGHER DEGREES: Orange Wave 3

DETAILS: Orange Wave 1 has completed, and Orange Wave 2 is progressing.
Wave Invalidation Level: 1681

On the weekly timeframe, Kotak Bank is engaged in a counter-trend correction within a larger bearish wave structure. The progression of Orange Wave 2 suggests a short-term retracement rather than a new bullish phase.

The upward movement should be interpreted as a limited corrective bounce. A price move beyond 1681 would challenge the current wave count, hinting at a more extended correction or a potential trend reversal.

Key Takeaways:

  • Weekly structure aligns with corrective movement.
  • Price action is part of a larger bearish pattern.
  • Invalidation level at 1681 must be monitored.
  • Risk management is essential during this corrective phase.

Technical Analyst: Malik Awais

Source: Visit Tradinglounge.com and learn from the Experts. Join TradingLounge Here 

Previous: STATE BANK OF INDIA Elliott Wave Technical Analysis

VALUE Offer - Buy 1 Month & Get 3 Months!Click here

Access 7 Analysts Over 200 Markets Covered. Chat Room With Support

KOTAK-BANK-weekly-Ch...

Related

SPDR Select Sector Fund ETF (XLE) Elliott Wave Technical Analysis: Energy Sector Rally Analysis, Price Targets, and US Market Update

SPDR Select Sector Fund ETF (XLE) Elliott Wave Technical Analysis: Energy Sector Rally Analysis, Price Targets, and US Market Update

The SPDR Energy Select Sector ETF (XLE) has completed wave (4) and is starting wave (5) of an impuls...

Read More >
S&P 500 Elliott Wave Analysis Reveals SPX Impulse Patterns, and Trading Strategies for Market Volatility Insights

S&P 500 Elliott Wave Analysis Reveals SPX Impulse Patterns, and Trading Strategies for Market Volatility Insights

S&P 500 Elliott Wave analysis from both daily and weekly perspectives. It highlights the current wav...

Read More >
In-depth look at the EUR/GBP Currency Pair using the Elliott Wave Theory: Insights into Potential Forex Market Movements

In-depth look at the EUR/GBP Currency Pair using the Elliott Wave Theory: Insights into Potential Forex Market Movements

This analysis provides an in-depth look at the EUR/GBP currency pair using the Elliott Wave theory. ...

Read More >
Texas Instruments Inc.(TXN:NASDAQ) Elliott Wave Technical Analysis 8 December 23

Texas Instruments Inc.(TXN:NASDAQ) Elliott Wave Technical Analysis 8 December 23

Texas Instruments Inc.(TXN: NASDAQ) Elliott Wave Technical Analysis with 4-Hour and 1-hour Chart dat...

Read More >
 NIKKEI 225 Elliott Wave Techniacl Analysis: Bullish Trends, Key Wave Levels, and Technical Chart Insights

NIKKEI 225 Elliott Wave Techniacl Analysis: Bullish Trends, Key Wave Levels, and Technical Chart Insights

The NIKKEI 225 index exhibits a robust bullish trend, analyzed through Elliott Wave principles. Both...

Read More >
How to apply Elliott Wave theory to USDJPY trading strategies and U.S. Dollar / Japanese Yen Forex Market Positioning

How to apply Elliott Wave theory to USDJPY trading strategies and U.S. Dollar / Japanese Yen Forex Market Positioning

This analysis provides a comprehensive breakdown of the USDJPY using Elliott Wave theory. Covering b...

Read More >

$1 for 2 Weeks

then $29 a month!

What a Special Offer!

Trade Recommendations

Unleash the power of deversified trading with our comprehensive portfolio, covering 250+ markets:

  • Stock Trades
  • Crypto Trades
  • Forex Trades
  • Commodity Trades
Elliott Wave Analysis

Gain a competitive edge with expert insights and AI-powered Elliott Wave charting into:

  • Global Indices
  • US Stocks & ASX Stocks
  • Forex & Crypto
  • Commodities
Top-Notch Trading Tools

Equip yourself with the tools of success:

  • Real-time Chat rooms
  • Elliott Wave Algorithm
  • Portfolio tools
  • TradingLevels
  • Screener
  • Trading Game
7 Elliott Wave Analysts

Stay ahead of the market with daily charts and insightful videos
Your secret to strategic trading!

JOIN HERE


Welcome to TradingLounge (ASIC A.R.No. 321187), specialists in trades, trading education and technical analysis, covering stocks, indices, commodities, forex and cryptocurrencies.

When you join TradingLounge you have access to everything we offer, including trade tools, educational content and a social platform to chat with like-minded investors.

Read more

@Copyright 2024 by tradinglounge.com

Contact Us

Australian no: 02 4787 6020

International no: +61 (2) 47876020

Pay with:

Find us on