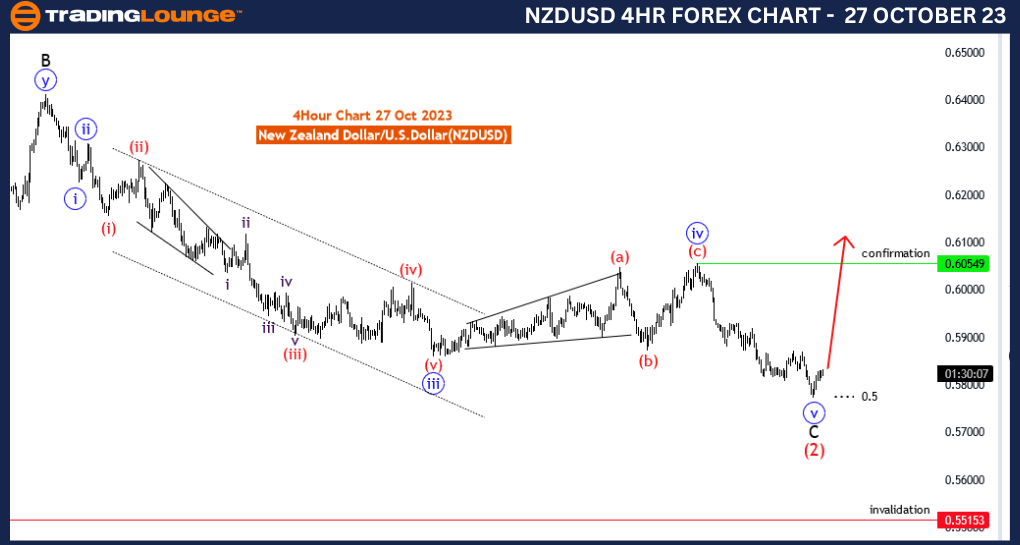
NZDUSD Elliott Wave Analysis Trading Lounge 4 Hour Chart, 27 October 23
New Zealand Dollar/U.S.Dollar (NZDUSD) 4 Hour Chart
NZDUSD Elliott Wave Technical Analysis
Function: Trend
Mode: impulsive
Structure: sub waves of new trend
Position: red wave 3
Direction Next higher Degrees:new trend may started
Details:blue wave 5 of C looking completed at fib level 0.5 ,now looking for new uptrend . Wave Cancel invalid level: 0.55153
The NZD/USD Elliott Wave Analysis for the 4-hour chart on 27 October 23, offers crucial insights into the potential future movements of the New Zealand Dollar/U.S. Dollar (NZD/USD) currency pair, providing valuable guidance for forex traders.
The analysis designates the function as "Trend," suggesting that the current price movement aligns with the prevailing trend. This indicates that the market is showing a propensity for continuing its current direction, which is essential information for traders seeking to participate in the established trend.
The mode is identified as "impulsive," signifying that the current trend is strong and characterizes the behavior of an impulsive market move. For traders, this mode often signals favorable conditions for capitalizing on the momentum within the trend.
The analysis is centered around "sub waves of the new trend." This is a pivotal concept as it implies that a new trend may be in the early stages of development, and traders need to monitor these sub waves for trading opportunities aligned with the emerging trend.
The text suggests that "blue wave 5 of C" is potentially completed at the Fibonacci retracement level of 0.5. The observation implies that the corrective phase (blue wave 5) has concluded, and the currency pair may be poised for a new uptrend. This is a critical point for traders to watch, as it may offer entry opportunities in the direction of the nascent trend.
The "Wave Cancel invalid level: 0.55153" serves as an important reference point. It represents the price level at which the described wave structure would be invalidated, potentially signaling a change in market dynamics or the need for reevaluation of the trading strategy.
In summary, the NZD/USD Elliott Wave Analysis for 27 October 23, offers insightful information for traders. The analysis implies the potential start of a new trend, and traders should monitor the market closely for opportunities aligned with this trend, while also being aware of the specified invalidation level as a risk management reference point.
Technical Analyst: Malik Awais
Source: Tradinglounge.com get trial here!
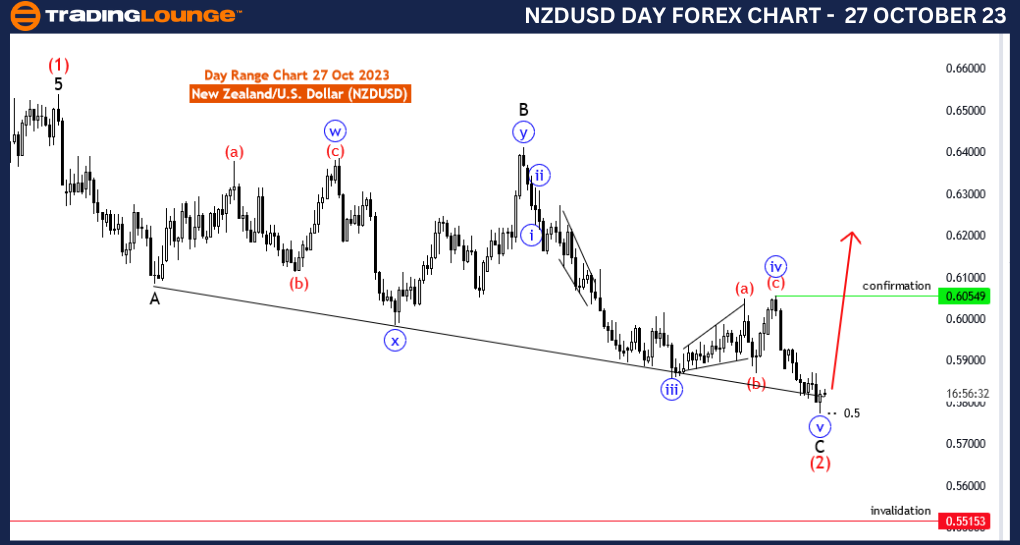
NZDUSD Elliott Wave Analysis Trading Lounge Day Chart, 27 October 23
New Zealand Dollar/U.S.Dollar (NZDUSD) Day Chart
NZDUSD Elliott Wave Technical Analysis
Function: Trend
Mode: impulsive
Structure: sub waves of new trend
Position: red wave 3
Direction Next higher Degrees:new trend may started
Details:blue wave 5 of C looking completed at fib level 0.5 ,now looking for new uptrend . Wave Cancel invalid level: 0.55153
The Elliott Wave Analysis for the NZD/USD currency pair, as presented in the "NZDUSD Elliott Wave Analysis Trading Lounge Day Chart" on 27 October 23, provides significant insights into the potential future movements of the New Zealand Dollar/U.S. Dollar (NZD/USD) for daily chart traders. It offers valuable information and guidance for forex traders seeking to make informed decisions.
The analysis starts by identifying the function as "Trend," indicating that the prevailing price movement is aligned with the existing market trend. This is an essential piece of information for traders, as it suggests that the market is currently moving in a directional trend, and traders should consider this trend's potential implications in their strategies.
The mode is specified as "impulsive," signifying that the market is currently demonstrating strong and decisive price action. In the world of Elliott Wave analysis, an impulsive move is often characterized by strong momentum in the direction of the trend. Traders may view this as a favorable condition for executing trades that align with the prevailing market direction.
The structural element mentioned is the "sub waves of the new trend," which implies that a new trend may be emerging in the market. Elliott Wave analysis often delves into subwave structures to identify the development of new trends or corrections within the broader market context. For traders, this signals that they should monitor these sub waves closely for potential trading opportunities that align with the evolving trend.
Specifically, the analysis highlights that "blue wave 5 of C" might be near completion, with the implication that the corrective phase may be coming to an end. In Elliott Wave theory, the completion of a corrective phase often signals the potential beginning of a new trend. This is a pivotal juncture for traders because identifying the transition from correction to trend can offer valuable entry opportunities.
The analysis specifies a crucial level to watch for, the "Wave Cancel invalid level: 0.55153." This level acts as a reference point, signaling that the described wave structure and the potential new trend may be invalidated if the price reaches or breaches this level. For traders, it serves as a risk management reference, helping them gauge the effectiveness of their trading strategy in the face of changing market conditions.
In summary, the NZD/USD Elliott Wave Analysis for the Day Chart on 27 October 23, offers substantial insights for forex traders. The analysis implies the potential emergence of a new trend, and traders should closely monitor the market for entry opportunities while keeping a watchful eye on the specified invalidation level to manage risk effectively. This information equips traders with the knowledge needed to make more informed trading decisions.
Technical Analyst: Malik Awais
Source: Tradinglounge.com get trial here!