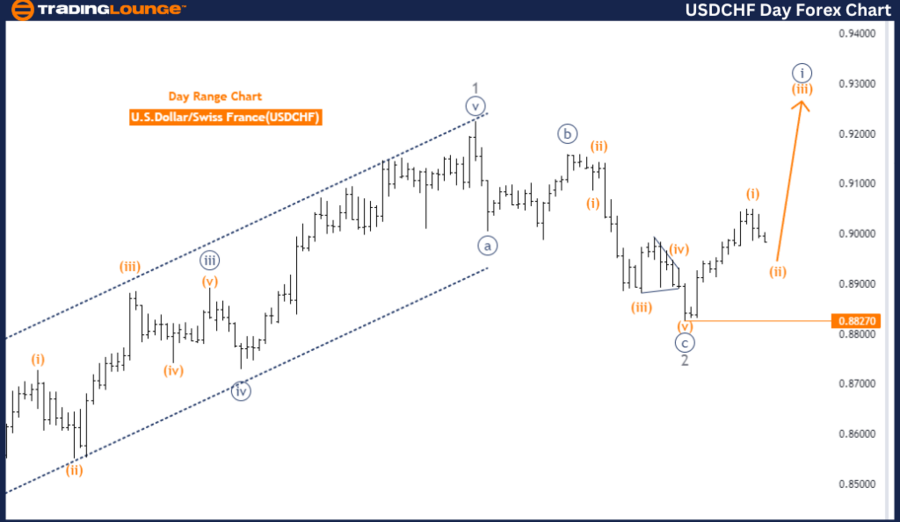
USDCHF Day Chart Description
USDCHF Elliott Wave Analysis - Trading Lounge Day Chart
USDCHF Day Chart Analysis
USDCHF Elliott Wave Technical Analysis
Function: Trend
Mode: Corrective
Structure: Orange Wave 2
Position: Navy Blue Wave 1
Next Higher Degree Direction: Orange Wave 3
Details: Orange Wave 1 completed, Orange Wave 2 in progress.
Wave Cancel Invalid Level: 1.88270
The USDCHF Elliott Wave Analysis for the day chart aims to identify the current trend and wave structure of the U.S. Dollar against the Swiss Franc. The primary objective is to understand the market's trend direction. Currently, the market is in a corrective phase, indicating a temporary pause or pullback within a larger trend.
The wave structure under analysis is Orange Wave 2, following the completion of Orange Wave 1. This suggests the initial impulsive move (Orange Wave 1) has ended, and the market is now undergoing a correction phase represented by Orange Wave 2.
The current position within the wave sequence is Navy Blue Wave 1. This indicates that the corrective phase (Orange Wave 2) is part of the first wave in a higher degree sequence, showing the market is still in the early stages of a larger trend cycle.
Looking ahead, the next higher degree direction points towards Orange Wave 3. After the corrective phase of Orange Wave 2 ends, the market is expected to resume its previous trend with a new impulsive move, identified as Orange Wave 3. This upcoming wave will likely continue the broader trend with renewed momentum.
Details note that Orange Wave 1 is complete, and the market is currently in the midst of Orange Wave 2. The wave cancel invalid level is set at 1.88270. This critical level acts as a threshold; if the market surpasses this point, the current wave structure would be invalidated, necessitating a re-evaluation and potential re-labeling of the wave counts.
Summary:
- The USDCHF day chart is currently in a corrective phase.
- Orange Wave 2 is in progress after Orange Wave 1 completion.
- Anticipation of Orange Wave 3 once the correction ends.
- Wave cancel invalid level: 1.88270.
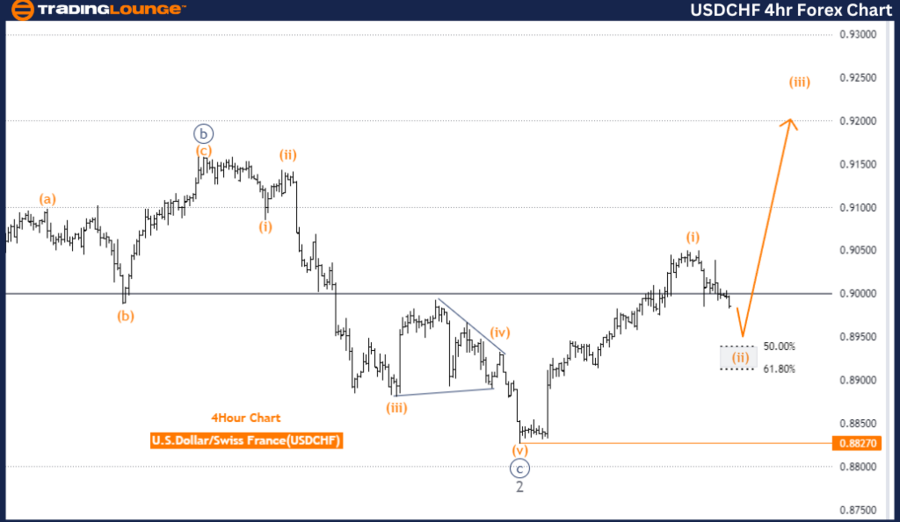
USDCHF 4-Hour Chart Description
USDCHF Elliott Wave Analysis - Trading Lounge 4-Hour Chart
USDCHF 4-Hour Chart Analysis
USDCHF Elliott Wave Technical Analysis
Function: Trend
Mode: Corrective
Structure: Orange Wave 2
Position: Navy Blue Wave 1
Next Higher Degree Direction: Orange Wave 3
Details: Orange Wave 1 completed, Orange Wave 2 in progress.
Wave Cancel Invalid Level: 1.88270
The USDCHF Elliott Wave Analysis for the 4-hour chart provides a detailed look at the current market trend. The analysis aims to identify and follow the market trend, currently in a corrective mode, suggesting a market retracement or consolidation phase rather than a strong directional move.
The wave structure under analysis is Orange Wave 2, which follows the completion of Orange Wave 1. This indicates the market has completed the initial impulsive move (Orange Wave 1) and is now in a correction phase (Orange Wave 2).
The position within the wave sequence is Navy Blue Wave 1, showing that the corrective wave (Orange Wave 2) is part of a larger wave pattern, specifically the first wave of a higher degree Navy Blue wave sequence.
Looking forward, the next higher degree direction points to Orange Wave 3. Once the current corrective phase (Orange Wave 2) concludes, the market is expected to begin a new impulsive move (Orange Wave 3), likely resuming the previous trend with renewed strength.
Details confirm that Orange Wave 1 is complete, and the market is currently in the corrective phase of Orange Wave 2. The wave cancel invalid level is set at 1.88270. If the market exceeds this level, the current wave structure would be invalidated, requiring a reassessment and potential re-labeling of the wave counts.
Summary:
- The USDCHF is in a corrective phase on the 4-hour chart.
- Orange Wave 2 in progress following Orange Wave 1 completion.
- Orange Wave 3 anticipated to start after current correction ends.
- Wave cancel invalid level: 1.88270.
Technical Analyst: Malik Awais
Source: visit Tradinglounge.com and learn From the Experts Join TradingLounge Here
Previous: NZDUSD Elliott Wave Technical Analysis
Special Trial Offer - 0.76 Cents a Day for 3 Months! Click here
Access 7 Analysts Over 170 Markets Covered. Chat Room With Support