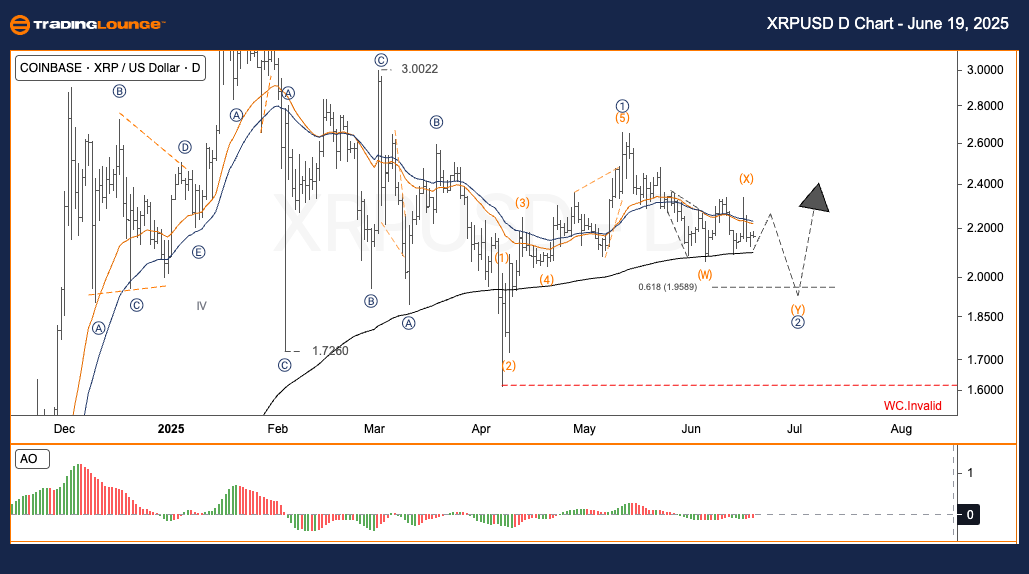
Ripple / U.S. Dollar (XRPUSD) Elliott Wave Analysis – TradingLounge | Daily Chart
XRPUSD Elliott Wave Technical Analysis
Function: Follow Trend
Mode: Motive
Structure: Impulse
Position: Wave 2
Direction Next Higher Degrees: Pending confirmation
Wave Cancel Invalidation Level: $1.613
Ripple (XRP) Trading Strategy Overview – Daily Chart
Ripple (XRP) peaked at $2.656 in May and is now in a corrective phase. From an Elliott Wave viewpoint, this correction is part of wave ② within a larger upward cycle. Currently, XRP seems to be nearing the end of wave (C), which concludes this correction.
Trading Strategies
✅ Swing Traders (Short-Term):
Monitor the $1.83 level for signs of a reversal. A rebound from this area could signal the start of wave ③ moving upward.
🟥 Critical Level:
If XRP drops below $1.613, the current wave structure becomes invalid, and a fresh wave analysis will be needed.
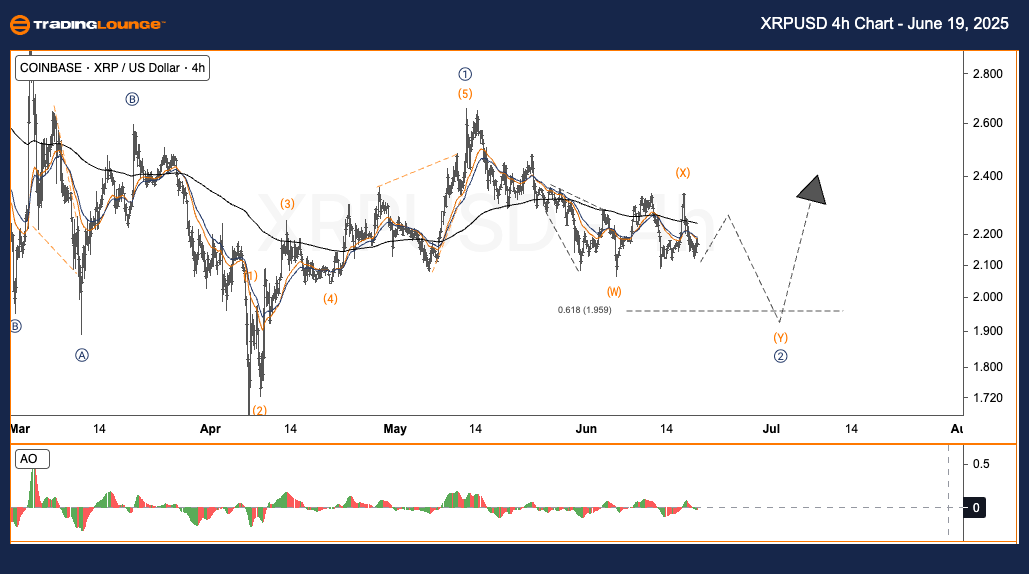
Ripple / U.S. Dollar (XRPUSD) Elliott Wave Analysis – TradingLounge | H4 Chart
XRPUSD Elliott Wave Technical Analysis
Function: Follow Trend
Mode: Motive
Structure: Impulse
Position: Wave 2
Direction Next Higher Degrees: Pending confirmation
Wave Cancel Invalidation Level: $1.613
Ripple (XRP) Trading Strategy Overview – H4 Chart
After hitting a high of $2.656 in May, Ripple has been in a corrective wave pattern. This pattern aligns with wave ② in a wider bullish structure and is likely in the final part of wave (C), suggesting a potential trend shift soon.
Trading Strategies
✅ Swing Traders (Short-Term):
Watch the $1.83 level closely. A bounce from this price may confirm the beginning of wave ③ upward.
🟥 Critical Level:
A fall below $1.613 invalidates the current Elliott Wave structure, prompting a reevaluation.
Technical Analyst: Malik Awais
Source: Visit Tradinglounge.com and learn from the Experts. Join TradingLounge Here
Previous: AAVE/USD Elliott Wave Technical Analysis
VALUE Offer - $1 for 2 Weeks then $29 a month!Click here
Access 7 Analysts Over 200 Markets Covered. Chat Room With Support