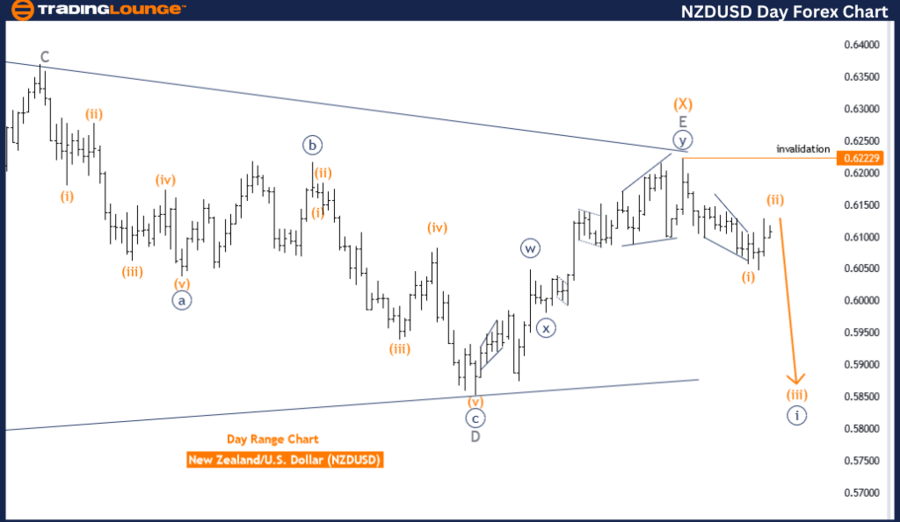
NZDUSD Elliott Wave Analysis Trading Lounge Day Chart
New Zealand Dollar/U.S. Dollar (NZDUSD) Day Chart Analysis
NZDUSD Elliott Wave Technical Analysis
Function: Trend
Mode: Corrective
Structure: Orange Wave 2
Position: Navy Blue Wave 1
Next Lower Degree Direction: Orange Wave 3
Details:
- Orange Wave 1 is completed.
- Orange Wave 2 of Navy Blue Wave 1 is nearing its end.
- Wave Cancel Invalid Level: 0.62229
The NZDUSD on the day chart is analyzed using Elliott Wave Theory. The analysis shows a trend, indicating an expected general movement in either an upward or downward direction over the period observed.
Currently, the trend is in a corrective mode, suggesting temporary pullbacks or adjustments against the larger trend direction. The primary focus is on Orange Wave 2, which represents a retracement or consolidation phase within the broader wave sequence.
The market is positioned in Navy Blue Wave 1, marking the initial move of a new wave sequence. The next lower degree direction is Orange Wave 3, which will commence following the completion of the ongoing corrective phase.
Detailed analysis indicates that Orange Wave 1 is now completed. Orange Wave 2 of Navy Blue Wave 1 is currently active, representing a corrective move before the next impulsive wave begins. Orange Wave 2 is nearing its end, signaling an imminent transition to Orange Wave 3.
The wave cancel invalid level is set at 0.62229. This critical threshold acts as a safeguard for the current wave count; if the market surpasses this point, the present wave structure would be invalidated, requiring a re-evaluation of the analysis.
Summary
The NZDUSD on the day chart is in a corrective phase within Orange Wave 2 of Navy Blue Wave 1. With Orange Wave 1 completed, Orange Wave 2 is nearing its conclusion, setting the stage for the subsequent impulsive phase, Orange Wave 3. The wave cancel invalid level is set at 0.62229, beyond which the current wave count would be reconsidered.
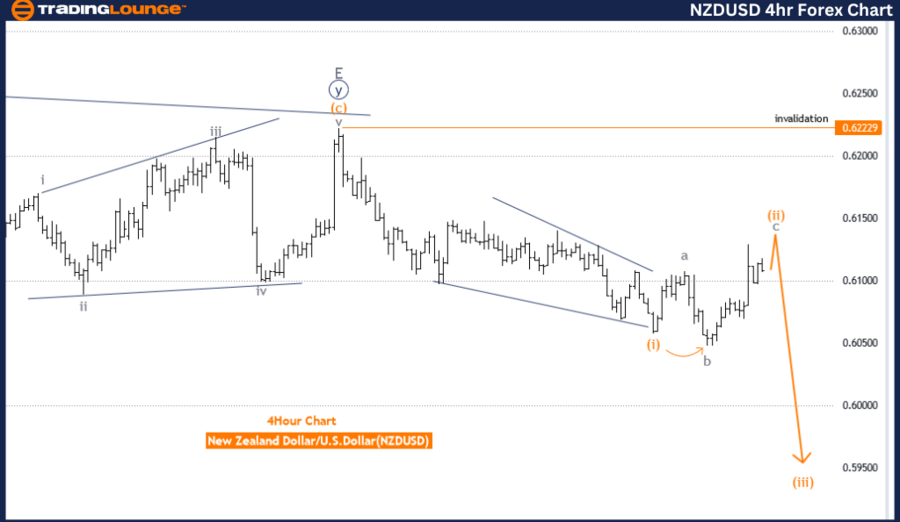
NZDUSD Elliott Wave Analysis Trading Lounge 4-Hour Chart
New Zealand Dollar/U.S. Dollar (NZDUSD) 4 Hour Chart Analysis
NZDUSD Elliott Wave Technical Analysis
Function: Trend
Mode: Corrective
Structure: Orange Wave 2
Position: Navy Blue Wave 1
Next Lower Degree Direction: Orange Wave 3
Details:
- Orange Wave 1 is completed.
- Orange Wave 2 of Navy Blue Wave 1 is nearing its end.
- Wave Cancel Invalid Level: 0.62229
The NZDUSD is analyzed using Elliott Wave Theory on the 4-hour chart. This analysis indicates a trend, suggesting an expected general movement in an upward or downward direction over the observed period.
Currently, the trend is in a corrective mode, indicating temporary pullbacks or adjustments against the larger trend direction. The focus is on Orange Wave 2, representing a retracement or consolidation phase within the broader wave sequence.
The market is positioned in Navy Blue Wave 1, marking the initial move of a new wave sequence. The next lower degree direction is Orange Wave 3, which will commence following the completion of the ongoing corrective phase.
Detailed analysis reveals that Orange Wave 1 is now completed. Orange Wave 2 of Navy Blue Wave 1 is currently active, representing a corrective move before the next impulsive wave begins. Orange Wave 2 is nearing its end, signaling an imminent transition to Orange Wave 3.
The wave cancel invalid level is set at 0.62229. This critical threshold acts as a safeguard for the current wave count; if the market surpasses this point, the present wave structure would be invalidated, requiring a re-evaluation of the analysis.
Summary
The NZDUSD on the 4-hour chart is in a corrective phase within Orange Wave 2 of Navy Blue Wave 1. With Orange Wave 1 completed, Orange Wave 2 is nearing its conclusion, setting the stage for the subsequent impulsive phase, Orange Wave 3. The wave cancel invalid level is set at 0.62229, beyond which the current wave count would be reconsidered.
Technical Analyst: Malik Awais
Source: visit Tradinglounge.com and learn From the Experts Join TradingLounge Here
Previous: Euro/U.S.Dollar (EURUSD) Elliott Wave Technical Analysis
Special Trial Offer - 0.76 Cents a Day for 3 Months! Click here
Access 7 Analysts Over 170 Markets Covered. Chat Room With Support