Soybeans Elliott Wave Analysis: Detailed Breakdown and Future Predictions

Soybeans Elliott Wave Technical Analysis

Function: Trend

Mode: Impulse

Structure: Impulse for (5)

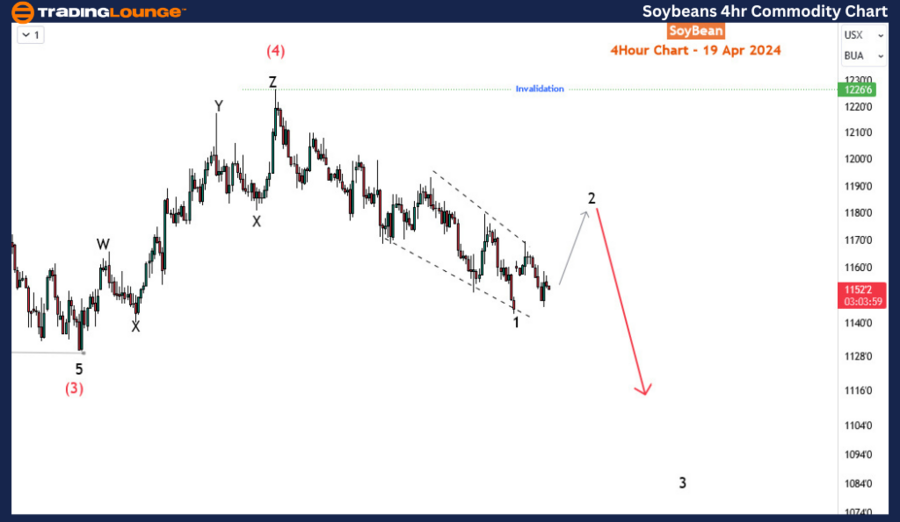
Position: Wave 1 of (5)

Direction: Wave 2 of (5)

Details: Completion of Wave 1 of (5) with a diagonal pattern. Emergence of Wave 2 bounce expected before a downward turn in Wave 3 of (5). Current invalidation level at 1226’6. Stability in the analysis since the last update.

Soybean Price Analysis: Elliott Wave Perspective Signals Continued Downward Trend

In the realm of commodity trading, Soybean has recently undergone a significant downturn, marking a nearly 7% drop since March 21st. This decline appears to be part of a broader trend that commenced back in June 2022. However, before this recent descent, there was a brief period of respite characterized by a corrective bounce starting in late February. 

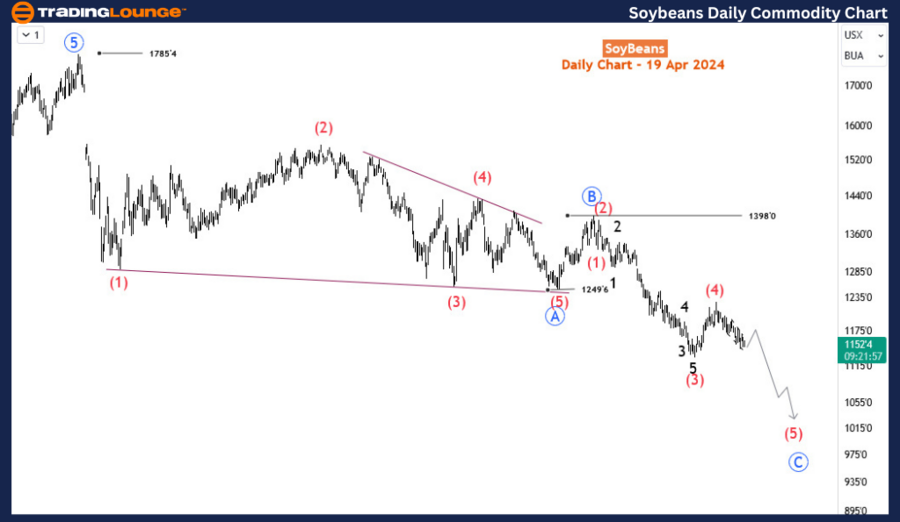
Delving deeper into the price action, an Elliott Wave analysis sheds light on the intricacies of Soybean's movement. The daily chart's decline since June 2022 reveals a corrective pattern, delineated into waves A-B-C, as denoted by blue annotations.

The initial wave, labelled as Blue Wave 'A', terminated at 1249 in October 2023, exhibiting a distinct diagonal pattern. Subsequently, a modest rebound ensued, marked by Blue Wave 'B', which concluded at 1398 in November 2023. However, the ascendancy was short-lived as the bears regained control, manifesting in the ongoing development of Blue Wave 'C'. This wave, evolving into an impulse wave, has currently progressed to wave (5) following the completion of wave (4) in March 2024.

Soybeans-1D-Commodit...


Focus Soyabin H4 Chart Analysis:

Zooming in on the H4 chart, a granular analysis reveals the sub-waves of wave (5). Wave 1 of (5) concluded with a diagonal structure, followed by a corrective phase as the price undergoes a temporary upside correction to complete wave 2. Despite uncertainties regarding whether wave 2 has fully concluded or will undergo another upward leg, the overarching trajectory remains clear – a downward break is anticipated to continue wave 3 of (5), leading to further downside movement.

In light of this analysis, the prevailing sentiment favours sellers, who continue to assert dominance over the commodity market. As long as the price remains below 1226’6, the outlook remains skewed towards further downside potential, with the possibility of reaching the lowest price point since November 2020.

In conclusion, the Elliott Wave perspective offers valuable insights into Soybean's price dynamics, signalling a continued bearish trajectory in the near term. While short-term fluctuations may occur, the broader trend suggests that sellers are likely to maintain control, shaping the commodity's price action in the foreseeable future.

Technical Analyst: Sanmi Adeagbo

Source: visit Tradinglounge.com and learn From the Experts Join TradingLounge Here 

See Previous: WTI Crude Oil Commodity

TradingLounge Once Off SPECIAL DEAL: Here > 1 month Get 3 months

TradingLounge's Free Week Extravaganza!

April 14 – 21: Unlock the Doors to Trading Excellence — Absolutely FREE

Soybeans-4Hr-Commodi...

Related

EURGBP Elliott Wave Counter‑Trend Setup: Impulsive Gray Wave A within Orange Wave Y with Navy Blue Wave 4 correction insights

EURGBP Elliott Wave Counter‑Trend Setup: Impulsive Gray Wave A within Orange Wave Y with Navy Blue Wave 4 correction insights

This article provides a detailed EURGBP Elliott Wave analysis on both daily and 4‑hour charts. High...

Read More >
Unlocking ASX Trading Success: TELSTRA GROUP LIMITED - TLS Stock Analysis & Elliott Wave Technical Forecast

Unlocking ASX Trading Success: TELSTRA GROUP LIMITED - TLS Stock Analysis & Elliott Wave Technical Forecast

Dive into the latest Telstra Group Limited (TLS.ASX) analysis with Elliott Wave insights. Learn abou...

Read More >
ASX Trading Success: SOUTH32 LIMITED (S32) Stock Analysis & Elliott Wave Technical Forecast

ASX Trading Success: SOUTH32 LIMITED (S32) Stock Analysis & Elliott Wave Technical Forecast

Our detailed Elliott Wave analysis covers the Australian Stock Exchange (ASX), featuring ASX Limited...

Read More >
Asian Paints Elliott Wave Analysis Reveals Bullish Trend Initiation with Critical Support and Potential Upward Price Movement

Asian Paints Elliott Wave Analysis Reveals Bullish Trend Initiation with Critical Support and Potential Upward Price Movement

The Elliott Wave analysis of Asian Paints indicates the formation of Orange Wave 1 within Navy Blue ...

Read More >
FTSE 100 (UK) Elliott Wave Analysis: Bullish Trend, Wave Counts, Market Forecast, and Trading Strategies for Informed Decisions

FTSE 100 (UK) Elliott Wave Analysis: Bullish Trend, Wave Counts, Market Forecast, and Trading Strategies for Informed Decisions

Our FTSE 100 Elliott Wave analysis provides valuable insights into the market's bullish trend an...

Read More >
EURUSD Elliott Wave Analysis: Bullish Trend Insights, Technical Forecasts, and Market Strategies for Forex Traders

EURUSD Elliott Wave Analysis: Bullish Trend Insights, Technical Forecasts, and Market Strategies for Forex Traders

EUR/USD Elliott Wave analysis, focusing on a bullish trend identified on the daily and 4-hour charts...

Read More >

$1 for 2 Weeks

then $29 a month!

What a Special Offer!

Trade Recommendations

Unleash the power of deversified trading with our comprehensive portfolio, covering 250+ markets:

  • Stock Trades
  • Crypto Trades
  • Forex Trades
  • Commodity Trades
Elliott Wave Analysis

Gain a competitive edge with expert insights and AI-powered Elliott Wave charting into:

  • Global Indices
  • US Stocks & ASX Stocks
  • Forex & Crypto
  • Commodities
Top-Notch Trading Tools

Equip yourself with the tools of success:

  • Real-time Chat rooms
  • Elliott Wave Algorithm
  • Portfolio tools
  • TradingLevels
  • Screener
  • Trading Game
7 Elliott Wave Analysts

Stay ahead of the market with daily charts and insightful videos
Your secret to strategic trading!

JOIN HERE


Welcome to TradingLounge (ASIC A.R.No. 321187), specialists in trades, trading education and technical analysis, covering stocks, indices, commodities, forex and cryptocurrencies.

When you join TradingLounge you have access to everything we offer, including trade tools, educational content and a social platform to chat with like-minded investors.

Read more

@Copyright 2024 by tradinglounge.com

Contact Us

Australian no: 02 4787 6020

International no: +61 (2) 47876020

Pay with:

Find us on