10Jun

EURGBP Elliott Wave Counter‑Trend Setup: Impulsive Gray Wave A within Orange Wave Y with Navy Blue Wave 4 correction insights

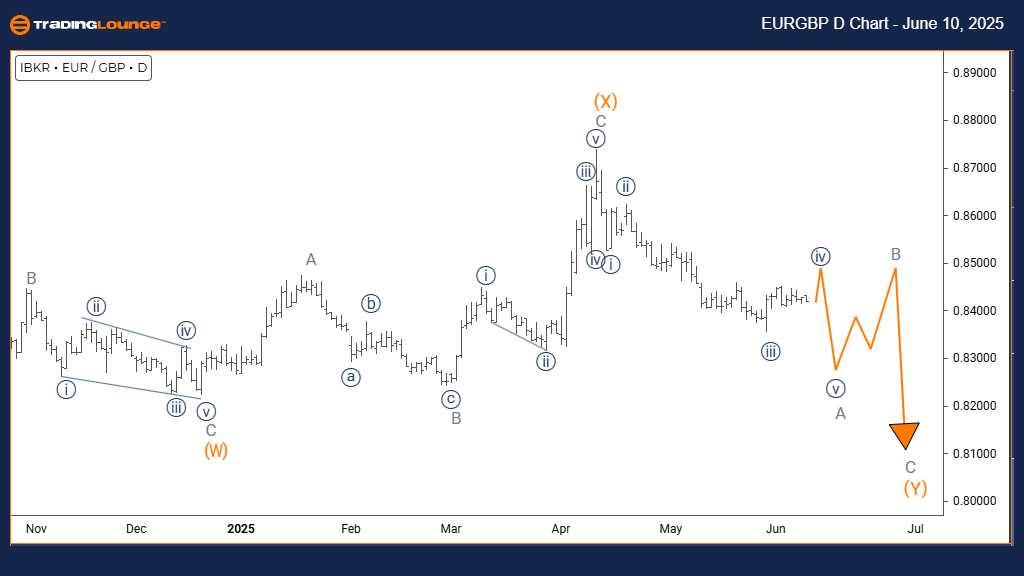
EURGBP Elliott Wave Analysis - TradingLounge Daily Chart

Euro/British Pound (EURGBP) Day Chart Analysis

EURGBP Elliott Wave Technical Analysis

FUNCTION: Counter Trend

MODE: Impulsive

STRUCTURE: Gray Wave A

POSITION: Orange Wave Y

DIRECTION NEXT HIGHER DEGREES: Gray Wave B

DETAILS: Orange Wave X has likely ended, and Gray Wave A of Orange Wave Y is now active.

The EURGBP daily chart highlights a counter-trend Elliott Wave setup, where impulsive movement suggests a strong price push against the major trend. Currently, the pair is forming Gray Wave A, which is the first leg of Orange Wave Y, a larger corrective pattern.

With Orange Wave X presumed complete, the development of Gray Wave A signifies the beginning of a potential zigzag correction. This movement indicates the early phase of a counter-trend correction, offering signs of upcoming volatility.

As this impulsive Gray Wave A continues to unfold, it is expected to gather momentum before giving way to Gray Wave B, which should correct part of Gray Wave A's movement. This phase is key in defining the structure and strength of the entire corrective pattern.

Traders should observe EURGBP closely for signs that Gray Wave A is peaking. The completion of this wave would likely initiate Gray Wave B, bringing a retracement phase. This segment of the wave count is critical for forecasting the next leg in the broader Orange Wave Y scenario.
EURGBP-forex-day-cha...


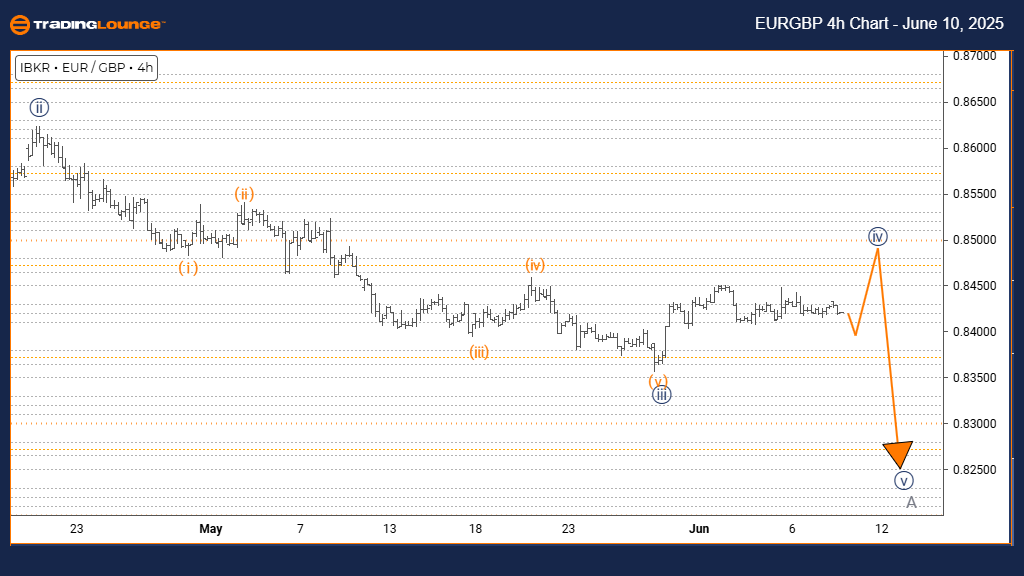
Euro/British Pound (EURGBP) 4-Hour Chart

EURGBP Elliott Wave Technical Analysis

FUNCTION: Counter Trend

MODE: Corrective

STRUCTURE: Navy Blue Wave 4

POSITION: Gray Wave A

DIRECTION NEXT LOWER DEGREES: Navy Blue Wave 5

DETAILS: Orange Wave 3 appears complete; Orange Wave 4 is progressing.

In the 4-hour EURGBP chart, a corrective counter-trend structure is forming, characterized as Navy Blue Wave 4. This wave unfolds within Gray Wave A, suggesting a temporary pause or pullback in the broader pattern.

Following the end of Orange Wave 3, the development of Orange Wave 4 signals a short-term correction. This move is expected to complete before Navy Blue Wave 5 starts, resuming the prior trend at the lower degree.

Currently, EURGBP remains within Orange Wave 4, which reflects short-term consolidation in price. As part of Gray Wave A, this correction may involve minor retracement or range-bound trading conditions.

Traders are advised to watch for indications that Orange Wave 4 is ending. Once confirmed, Navy Blue Wave 5 is likely to emerge, continuing the underlying directional trend. This brief corrective window may offer tactical trade opportunities within the ongoing Gray Wave A correction.

Technical Analyst: Malik Awais

Source: Visit Tradinglounge.com and learn from the Experts. Join TradingLounge Here

Previous: AUDUSD Elliott Wave Technical Analysis

VALUE Offer - Buy 1 Month & Get 3 Months!Click here

Access 7 Analysts Over 200 Markets Covered. Chat Room With Support
EURGBP-forex-4h-char...

Related

Silver Commodity Elliott Wave Forecast: XAGUSD Technical Analysis Signals End of Correction and Start of Bullish Trading Opportunity

Silver Commodity Elliott Wave Forecast: XAGUSD Technical Analysis Signals End of Correction and Start of Bullish Trading Opportunity

Silver is in a wave (2) correction phase nearing completion. Learn what Elliott Wave patterns reveal...

Read More >
Tesla Inc.(TSLA:NASDAQ) Elliott Wave Technical Analysis 17 November 23

Tesla Inc.(TSLA:NASDAQ) Elliott Wave Technical Analysis 17 November 23

Tesla Inc.(TSLA:NASDAQ) Elliott Wave Technical Analysis 17 November 23 shows TSLA Stock Market Analy...

Read More >
ASX NEM Elliott Wave Forecast Reveals Bullish Newmont Price Targets, Key Invalidation Points, and Uptrend Strategy for Gold Stocks

ASX NEM Elliott Wave Forecast Reveals Bullish Newmont Price Targets, Key Invalidation Points, and Uptrend Strategy for Gold Stocks

This article provides an Elliott Wave-based technical analysis of Newmont Corporation (ASX: NEM), hi...

Read More >
RUSSELL 2000 Index Elliott Wave Technical Analysis: Best Stocks to buy and Market Forecasts

RUSSELL 2000 Index Elliott Wave Technical Analysis: Best Stocks to buy and Market Forecasts

This article offers an in-depth Elliott Wave analysis of the Russell 2000, providing valuable insigh...

Read More >
Offering a Complete AAVE/USD Trading Insights: AAVEUSD Elliott Wave Technical Analysis and Current Market Trends

Offering a Complete AAVE/USD Trading Insights: AAVEUSD Elliott Wave Technical Analysis and Current Market Trends

This article provides a comprehensive Elliott Wave analysis of AAVEUSD, covering current market tren...

Read More >

$1 for 2 Weeks

then $29 a month!

What a Special Offer!

Trade Recommendations

Unleash the power of deversified trading with our comprehensive portfolio, covering 250+ markets:

  • Stock Trades
  • Crypto Trades
  • Forex Trades
  • Commodity Trades
Elliott Wave Analysis

Gain a competitive edge with expert insights and AI-powered Elliott Wave charting into:

  • Global Indices
  • US Stocks & ASX Stocks
  • Forex & Crypto
  • Commodities
Top-Notch Trading Tools

Equip yourself with the tools of success:

  • Real-time Chat rooms
  • Elliott Wave Algorithm
  • Portfolio tools
  • TradingLevels
  • Screener
  • Trading Game
7 Elliott Wave Analysts

Stay ahead of the market with daily charts and insightful videos
Your secret to strategic trading!

JOIN HERE


Welcome to TradingLounge (ASIC A.R.No. 321187), specialists in trades, trading education and technical analysis, covering stocks, indices, commodities, forex and cryptocurrencies.

When you join TradingLounge you have access to everything we offer, including trade tools, educational content and a social platform to chat with like-minded investors.

Read more

@Copyright 2024 by tradinglounge.com

Contact Us

Australian no: 02 4787 6020

International no: +61 (2) 47876020

Pay with:

Find us on