Trading Lounge Elliott Wave Analysis for AUDUSD Day Chart
The Australian Dollar/U.S. Dollar (AUDUSD) Elliott Wave Analysis provides valuable insights into potential market movements, aiding traders in making informed decisions. This analysis encompasses both daily and 4-hour chart perspectives, revealing trends, impulsive and corrective phases, and crucial levels to watch for. Discover how Elliott Wave principles can enhance your forex trading strategy.
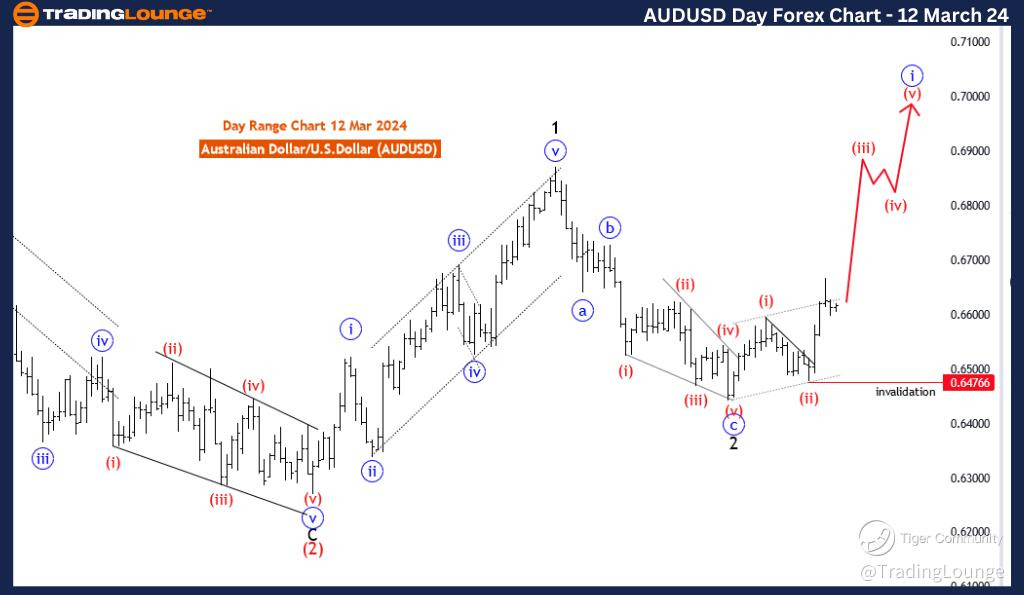
Australian Dollar/U.S.Dollar (AUDUSD) Day Chart Analysis
AUDUSD Elliott Wave Technical Analysis
FUNCTION: Trend
MODE: impulsive
STRUCTURE: red wave 3
POSITION: Blue Wave 1
DIRECTION NEXT LOWER DEGREES: red wave 4
DETAILS: red wave 2 looking completed at 0.64766. Now Red Wave 3 is in play. Wave Cancel invalid level: 0.64766
The AUD/USD Elliott Wave Analysis for the daily chart on 12 March 24, provides a comprehensive examination of potential market movements in the Australian Dollar/U.S. Dollar currency pair, utilizing Elliott Wave principles within the realm of technical analysis.
The identified "FUNCTION" is classified as "Trend," indicating a focus on capturing and understanding the directional movements within the broader trend. This signals an expectation for sustained price movements.
The "MODE" is defined as "Impulsive," suggesting that the current market phase is characterized by impulsive price actions. Impulsive phases typically represent strong, directional moves in the market.
The "STRUCTURE" is specified as "red wave 3," highlighting the current impulsive wave within the Elliott Wave count. In Elliott Wave theory, impulsive waves are characterized by strong, directional price movements that follow the prevailing trend.
The "POSITION" is identified as "blue wave 1," denoting the placement of the current impulsive wave within the larger Elliott Wave structure. Blue wave 1 represents a lower-degree wave within the ongoing Elliott Wave count.
"DIRECTION NEXT LOWER DEGREES" is highlighted as "red wave 4," indicating the anticipated direction for the subsequent lower-degree wave. This implies an expectation for a corrective phase following the completion of the current impulsive wave.
In the "DETAILS" section, it is mentioned that "red wave 2 looking completed at 0.64766." This suggests the end of the corrective phase (red wave 2) and the initiation of the impulsive wave (red wave 3). The "Wave Cancel invalid level" is set at 0.64766,
serving as a critical reference point. Any breach beyond this level would invalidate the current wave count, prompting a reassessment of the analysis.
In summary, the AUD/USD Elliott Wave Analysis for the daily chart on 12 March 24, indicates an impulsive phase labeled as red wave 3 within the broader context of blue wave 1. The analysis anticipates a corrective phase (red wave 4) following the completion of the current impulsive wave. The Wave Cancel invalid level at 0.64766 serves as a key threshold for monitoring potential shifts in the wave count and trend dynamics.
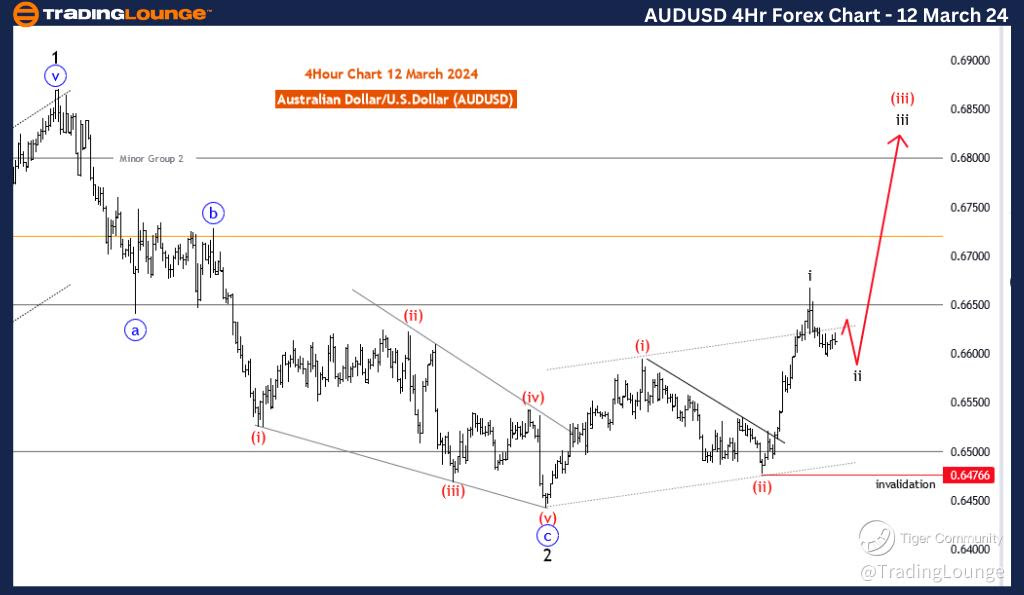
AUDUSD Elliott Wave Analysis Trading Lounge 4 Hour Chart, 12 March 24
Australian Dollar/U.S.Dollar (AUDUSD) 4 Hour Chart Analysis
AUDUSD Elliott Wave Technical Analysis
FUNCTION: Trend
MODE: Corrective
STRUCTURE: black wave 2
POSITION: Red Wave 3
DIRECTION NEXT HIGHER DEGREES: black wave 3
DETAILS: black wave 2 of red wave 3 is in play , after that black wave 3 of 3 will start .Wave Cancel invalid level: 0.64766
The AUD/USD Elliott Wave Analysis for the 4-hour chart on 12 March 24, provides insights into the potential future movements of the Australian Dollar/U.S. Dollar currency pair, utilizing Elliott Wave principles for technical analysis.
The identified "FUNCTION" is categorized as "Trend," indicating that the analysis is focused on capturing potential directional movements within the broader trend context. This suggests an expectation for sustained price movements rather than mere corrections.
The "MODE" is defined as "Corrective," highlighting the current market phase characterized by corrective price actions. Corrective phases typically involve price adjustments or sideways movements that serve to balance or counteract preceding trends.
The "STRUCTURE" is specified as "black wave 2," signifying the current corrective wave within the Elliott Wave count. In Elliott Wave theory, corrective waves are counter-trend movements that temporarily interrupt the prevailing trend.
The "POSITION" is identified as "red wave 3," denoting the placement of the current corrective wave within the larger Elliott Wave structure. Red wave 3 represents a higher-degree wave within the ongoing Elliott Wave count.
"DIRECTION NEXT HIGHER DEGREES" is highlighted as "black wave 3," indicating the anticipated direction for the subsequent higher-degree wave. This suggests an expectation for the resumption of the broader trend after the completion of the current corrective phase.
In the "DETAILS" section, it is mentioned that "black wave 2 of red wave 3 is in play," suggesting that the current corrective wave is unfolding within the framework of a higher-degree wave. Additionally, it is noted that "after that, black wave 3 of 3 will start,"
implying an expectation for a stronger directional movement once the current correction concludes.
The "Wave Cancel invalid level" is set at 0.64766. This level serves as a critical reference point, and any breach beyond it would invalidate the current wave count, prompting a reassessment of the analysis.
In summary, the AUD/USD Elliott Wave Analysis for the 4-hour chart on 12 March 24, suggests a corrective phase labeled as black wave 2 within the broader context of red wave 3. The analysis anticipates a resumption of the broader trend with the onset of black wave 3 after the completion of the current correction. The Wave Cancel invalid level at 0.64766 serves as a key threshold for monitoring potential shifts in the wave count and trend dynamics.
Technical Analyst: Malik Awais
Source: visit Tradinglounge.com and learn From the Experts Join TradingLounge Here
See Previous: U.S.Dollar /Canadian Dollar (USD/CAD)
TradingLounge Once Off SPECIAL DEAL: Here > 1 month Get 3 months.