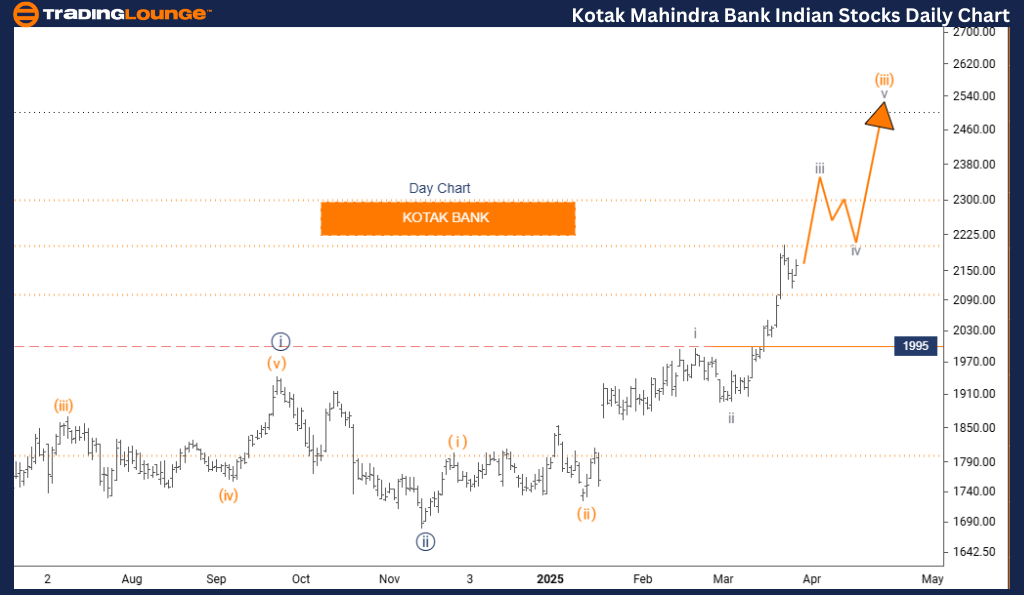
KOTAK BANK Elliott Wave Analysis – TradingLounge Day Chart
KOTAK BANK Elliott Wave Technical Analysis
Function: Bullish Trend
Mode: Impulsive
Structure: Gray Wave 3
Position: Orange Wave 3
Direction (Next Lower Degrees): Gray Wave 4
Invalidation Level: 1995
Technical Overview:
KOTAK BANK is exhibiting a bullish Elliott Wave structure on the daily chart. The stock is progressing through gray wave 3, part of the larger orange wave 3 sequence. With gray wave 2 now concluded, gray wave 3 is unfolding—often the strongest segment in Elliott Wave theory.
This suggests strong upside momentum for KOTAK BANK share price. The key Elliott Wave invalidation level is at 1995; any price action below this threshold would challenge the current bullish count.
Market Context:
The chart confirms an impulsive Elliott Wave trend. Once gray wave 3 completes, a pullback in gray wave 4 is anticipated, potentially followed by a continuation into gray wave 5. This wave structure offers traders a clearer view of the ongoing trend and upcoming price movements.
Gray wave 3 is typically associated with powerful rallies, higher trading volume, and consistent upward price moves—essential metrics for traders tracking KOTAK BANK's technical setup.
Strategic Implications:
Given the current wave configuration, holding long positions is supported. That said, risk controls should be applied, especially near the 1995 invalidation zone.
This analysis is vital for investors and swing traders focusing on bullish Elliott Wave patterns in the banking sector, helping refine entry and exit strategies.
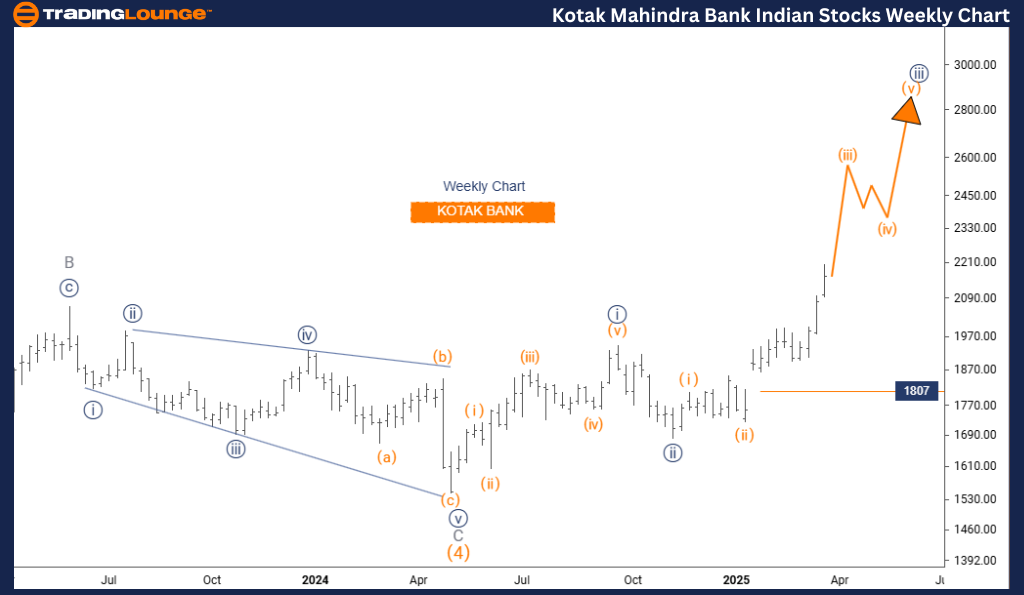
KOTAK BANK Elliott Wave Analysis – TradingLounge Weekly Chart
KOTAK BANK Elliott Wave Technical Analysis
Function: Bullish Trend
Mode: Impulsive
Structure: Orange Wave 3
Position: Navy Blue Wave 3
Direction (Next Higher Degrees): Orange Wave 3
Invalidation Level: 1807
Technical Overview:
The weekly Elliott Wave review of KOTAK BANK signals a sustained bullish trend. The focus remains on orange wave 3, embedded within a broader navy blue wave 3 cycle. Following the completion of orange wave 2, orange wave 3 has begun—recognized as one of the most extended and aggressive waves in Elliott Wave patterns.
This scenario reflects robust upside potential for KOTAK BANK stock, with the invalidation level at 1807. A decline beneath this point would nullify the bullish projection and warrant a revised analysis.
Market Context:
From a weekly perspective, the chart illustrates KOTAK BANK's advance within a larger impulsive wave sequence. The overlapping structure of orange wave 3 and navy blue wave 3 reinforces the bullish outlook, making it attractive for long-term investors.
Orange wave 3 is often linked with sharp upward momentum, increased buying volume, and fast-paced rallies. These dynamics are important signals for those evaluating trend continuation.
Strategic Implications:
Holding long positions is consistent with the current bullish wave formation. Traders should still manage downside risk, particularly as prices move closer to the 1807 invalidation level.
This weekly wave analysis supports both short- and long-term trading plans by identifying key trend phases in KOTAK BANK’s Elliott Wave structure, guiding optimized decision-making.
Technical Analyst: Malik Awais
Source: visit Tradinglounge.com and learn From the Experts Join TradingLounge Here
Previous: COAL INDIA Elliott Wave Technical Analysis
VALUE Offer - Buy 1 Month & Get 3 Months!Click here
Access 7 Analysts Over 200 Markets Covered. Chat Room With Support