WTI Crudeoil Commodity Elliott Wave Analysis

WTI Elliott Wave Technical Analysis

WTI Price Recovery and Potential Upside in 2024

WTI crude oil is showing signs of recovery from the low reached in September 2024 and may advance further towards the $80-$90 range in the coming weeks. This bullish corrective sequence has been unfolding since May 2023. As long as the dips do not break below the September 2024 low of $65.3, the short-term outlook remains bullish.

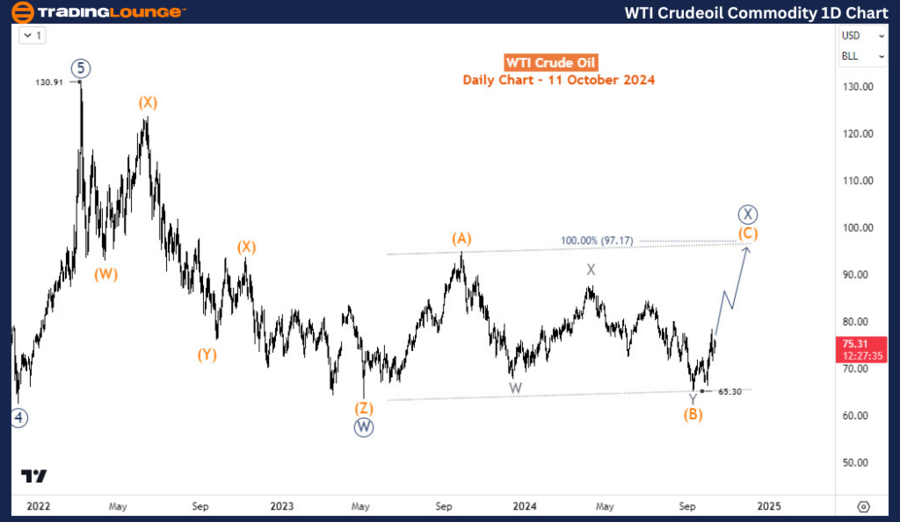
WTI Crudeoil Commodity Day Chart Analysis

Long-Term Elliott Wave Perspective for WTI

From a broader perspective, WTI is still in a corrective phase following the significant rally to $130.9 in March 2022. This rally was driven by an impulse wave sequence that began in April 2022. The current correction appears to be taking the form of a double zigzag pattern, with wave ((W)) completing in May 2023 and wave ((X)) starting thereafter.

According to the daily chart analysis, waves (A) and (B) of wave ((X)) completed in October 2023 and September 2024, respectively. The ongoing rally from the $65.3 low marks wave (C), which could potentially push WTI prices to $97.17 if the Elliott wave analysis holds. A drop below $65.3 would indicate that wave ((X)) had already finished at the September 2023 high, leading to a bearish outlook as wave ((Y)) continues, potentially driving prices towards $50 or lower.

WTI-Crudeoil-Commodi...


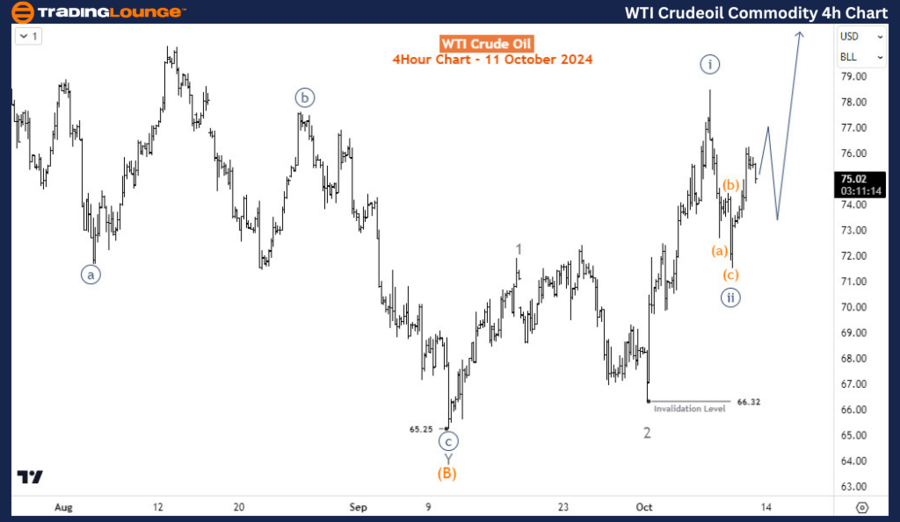
WTI Crudeoil Commodity 4-Hour Chart Analysis

H4 Chart and Short-Term WTI Price Projections

On the 4-hour chart, WTI is currently in wave 3 of the Elliott wave pattern, specifically in sub-wave ((iii)) of 3 after completing sub-wave ((ii)) at $71.56. Confirmation of this move would come with a break above the sub-wave ((i)) high. In the short term, wave ((iii)) is expected to extend, with the potential to push WTI prices above $80.

Technical Analyst: Sanmi Adeagbo

Source: visit Tradinglounge.com and learn From the Experts Join TradingLounge Here 

See Previous: Silver Elliott Wave Technical Analysis

VALUE Offer - Buy 1 Month & Get 3 Months!Click here

Access 7 Analysts Over 200 Markets Covered. Chat Room With Support

WTI-Crudeoil-Commodi...

Related

U.S.Dollar/Japanese Yen (USDJPY) Elliott Wave Technical Analysis 29 January 24

U.S.Dollar/Japanese Yen (USDJPY) Elliott Wave Technical Analysis 29 January 24

The USDJPY Elliott Wave Analysis dated 29 January 24, provides a comprehensive examination of the U....

Read More >
Commodity Market Insights: Crypto Trends, Forex Movements, and Metals Analysis for Strategic Trading

Commodity Market Insights: Crypto Trends, Forex Movements, and Metals Analysis for Strategic Trading

Summary: Bitcoin, DOT, and XRP show upward trends in the crypto market, prompting consideration of l...

Read More >
SEIUSD Elliott Wave Technical Analysis: SEI Crypto Price Prediction, Trading Strategy, Fibonacci Support, and Future Market Outlook

SEIUSD Elliott Wave Technical Analysis: SEI Crypto Price Prediction, Trading Strategy, Fibonacci Support, and Future Market Outlook

SEIUSD has completed a major correction and started a new bullish wave. Discover key Fibonacci suppo...

Read More >
U.S.Dollar/Canadian Dollar(USD/CAD) Elliott Wave Technical Analysis 15 January 24

U.S.Dollar/Canadian Dollar(USD/CAD) Elliott Wave Technical Analysis 15 January 24

The USD/CAD Elliott Wave Analysis for the daily chart on 15 January 24, suggests that the market is ...

Read More >
Newmont Corporation ASX: NEM Elliott Wave Analysis Reveals Bullish Price Targets and Trading Signals for Gold Stock Investors

Newmont Corporation ASX: NEM Elliott Wave Analysis Reveals Bullish Price Targets and Trading Signals for Gold Stock Investors

Elliott Wave analysis for Newmont Corporation (ASX: NEM), highlighting key price targets, bullish st...

Read More >
ASX Stock Elliott Wave Technical Analysis: BLOCK, INC – XYZ (SQ2) Highlighting a Potential Market Bottom at 61.42

ASX Stock Elliott Wave Technical Analysis: BLOCK, INC – XYZ (SQ2) Highlighting a Potential Market Bottom at 61.42

This article provides an in-depth Elliott Wave technical analysis of Block Inc (ASX: SQ2). It highli...

Read More >

$1 for 2 Weeks

then $29 a month!

What a Special Offer!

Trade Recommendations

Unleash the power of deversified trading with our comprehensive portfolio, covering 250+ markets:

  • Stock Trades
  • Crypto Trades
  • Forex Trades
  • Commodity Trades
Elliott Wave Analysis

Gain a competitive edge with expert insights and AI-powered Elliott Wave charting into:

  • Global Indices
  • US Stocks & ASX Stocks
  • Forex & Crypto
  • Commodities
Top-Notch Trading Tools

Equip yourself with the tools of success:

  • Real-time Chat rooms
  • Elliott Wave Algorithm
  • Portfolio tools
  • TradingLevels
  • Screener
  • Trading Game
7 Elliott Wave Analysts

Stay ahead of the market with daily charts and insightful videos
Your secret to strategic trading!

JOIN HERE


Welcome to TradingLounge (ASIC A.R.No. 321187), specialists in trades, trading education and technical analysis, covering stocks, indices, commodities, forex and cryptocurrencies.

When you join TradingLounge you have access to everything we offer, including trade tools, educational content and a social platform to chat with like-minded investors.

Read more

@Copyright 2024 by tradinglounge.com

Contact Us

Australian no: 02 4787 6020

International no: +61 (2) 47876020

Pay with:

Find us on