15Jan

DOTUSD Elliott Wave Technical Analysis: Polkadot Price Prediction, Technical Forecast, Fibonacci Retracement, and Trading Strategies

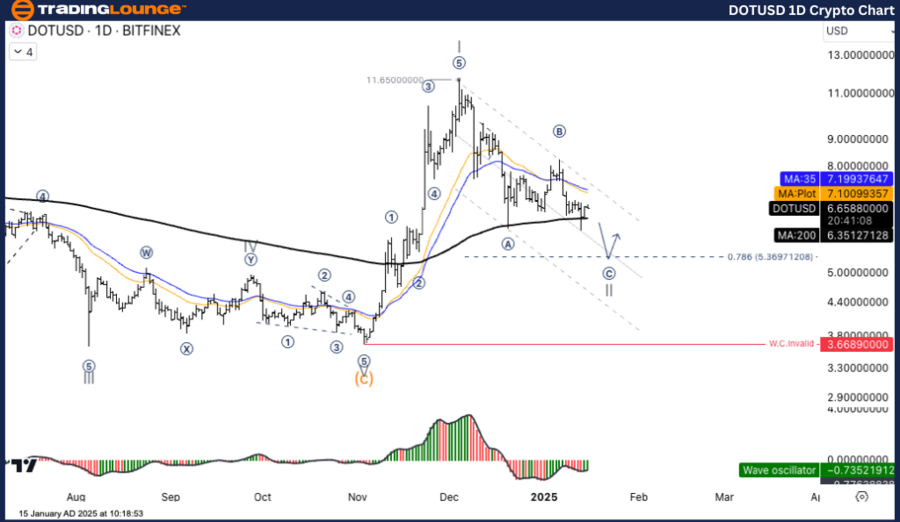
DOT/USD (Polkadot to U.S. Dollar) Elliott Wave Analysis: Daily Chart

DOTUSD Elliott Wave Technical Analysis

Function: Counter Trend

Mode: Corrective

Structure: Zigzag

Position: Wave ((C))

Next Higher Degree Direction: Wave II

Invalidation Level: N/A

DOT/USD Trading Strategy

The current analysis suggests that DOT/USD is moving lower within Wave C, targeting the 5.3691 support level, aligning with the 78.6% Fibonacci retracement level. Once the corrective Wave C concludes, completing the Wave (II) structure, the price is expected to initiate a new uptrend, marking the onset of Wave (III).

Main Outlook:

  • Short-Term Perspective: The price remains in a downtrend as part of Wave C.
  • Long-Term Perspective: Following the corrective phase, the price may shift into an uptrend in Wave (III), which aligns with the broader Elliott Wave structure.

DOTUSD-1d-crypto-cha...


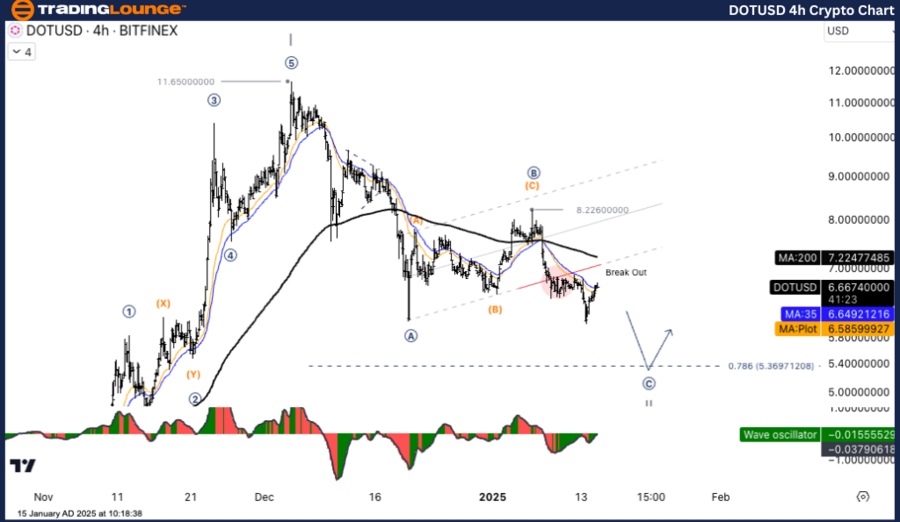
DOT/USD (Polkadot to U.S. Dollar) Elliott Wave Analysis: 4-Hour Chart 

DOTUSD Elliott Wave Technical Analysis

Function: Counter Trend

Mode: Corrective

Structure: Zigzag

Position: Wave ((C))

Next Higher Degree Direction: Wave II

Invalidation Level: N/A

DOT/USD Trading Strategy

The short-term analysis for DOT/USD continues to project a decline in Wave C, targeting the 5.3691 support level, correlating with the 78.6% Fibonacci retracement. After Wave C concludes, the Wave (II) correction should give way to a Wave (III) uptrend, signaling a potential price reversal and upward momentum.

Main Outlook:

  • Short-Term Perspective: The market remains bearish, with further downside in Wave C expected.
  • Long-Term Perspective: Upon completing the corrective Wave (II), the price may transition to Wave (III), initiating a strong uptrend as part of the larger market cycle.

Technical Analyst: Kittiampon Somboonsod

Source: visit Tradinglounge.com and learn From the Experts Join TradingLounge Here 

Previous: AAVEUSD Elliott Wave Technical Analysis

VALUE Offer - Buy 1 Month & Get 3 Months!Click here

Access 7 Analysts Over 200 Markets Covered. Chat Room With Support

DOTUSD-4h-crypto-cha...

Related

The Coca-Cola KO Stock Forecast: Elliott Wave Analysis Predicts Bullish Wave 3 Breakout Toward $100 Price Target with Strong Momentum

The Coca-Cola KO Stock Forecast: Elliott Wave Analysis Predicts Bullish Wave 3 Breakout Toward $100 Price Target with Strong Momentum

Elliott Wave analysis of Coca-Cola (KO) reveals a bullish setup on both the daily and hourly charts....

Read More >
Australian Dollar/U.S.Dollar (AUDUSD) Forex Elliott Wave Technical Analysis: A Comprehensive Review

Australian Dollar/U.S.Dollar (AUDUSD) Forex Elliott Wave Technical Analysis: A Comprehensive Review

This detailed analysis of the AUDUSD pair using Elliott Wave Theory provides current trends and futu...

Read More >
AMCOR PLC – AMC Elliott Wave Forecast Reveals Bullish Wave 3 Setup with Price Targets, Stock Analysis, and Trading Strategy

AMCOR PLC – AMC Elliott Wave Forecast Reveals Bullish Wave 3 Setup with Price Targets, Stock Analysis, and Trading Strategy

AMCOR PLC (ASX: AMC) uses Elliott Wave Theory to forecast a potential bullish trend. With Wave (2) c...

Read More >
EURUSD Elliott Wave Forecast: Bullish Impulse Wave 1 Setup Near Completion With Pullback and Trend Continuation Expected

EURUSD Elliott Wave Forecast: Bullish Impulse Wave 1 Setup Near Completion With Pullback and Trend Continuation Expected

EURUSD is showing a bullish impulsive wave structure. Wave 1 is near completion, suggesting a pullba...

Read More >
V300AEQ ETF UNITS – VAS Stock Analysis & Elliott Wave Technical Forecast: Detailed insights into market trends

V300AEQ ETF UNITS – VAS Stock Analysis & Elliott Wave Technical Forecast: Detailed insights into market trends

Our comprehensive Elliott Wave analysis for ASX: V300AEQ ETF Units – VAS provides detailed insights...

Read More >
WTI Crude Oil Elliott Wave Technical Analysis: Timing the End of Corrective Rally

WTI Crude Oil Elliott Wave Technical Analysis: Timing the End of Corrective Rally

Stay ahead of the curve with the latest analysis of WTI Crude's corrective rally through Elliott...

Read More >

$1 for 2 Weeks

then $29 a month!

What a Special Offer!

Trade Recommendations

Unleash the power of deversified trading with our comprehensive portfolio, covering 250+ markets:

  • Stock Trades
  • Crypto Trades
  • Forex Trades
  • Commodity Trades
Elliott Wave Analysis

Gain a competitive edge with expert insights and AI-powered Elliott Wave charting into:

  • Global Indices
  • US Stocks & ASX Stocks
  • Forex & Crypto
  • Commodities
Top-Notch Trading Tools

Equip yourself with the tools of success:

  • Real-time Chat rooms
  • Elliott Wave Algorithm
  • Portfolio tools
  • TradingLevels
  • Screener
  • Trading Game
7 Elliott Wave Analysts

Stay ahead of the market with daily charts and insightful videos
Your secret to strategic trading!

JOIN HERE


Welcome to TradingLounge (ASIC A.R.No. 321187), specialists in trades, trading education and technical analysis, covering stocks, indices, commodities, forex and cryptocurrencies.

When you join TradingLounge you have access to everything we offer, including trade tools, educational content and a social platform to chat with like-minded investors.

Read more

@Copyright 2024 by tradinglounge.com

Contact Us

Australian no: 02 4787 6020

International no: +61 (2) 47876020

Pay with:

Find us on