14Jan

AAVEUSD Elliott Wave Technical Analysis: Detailed Price Prediction, A-B-C Pattern, and Expert Trading Strategies

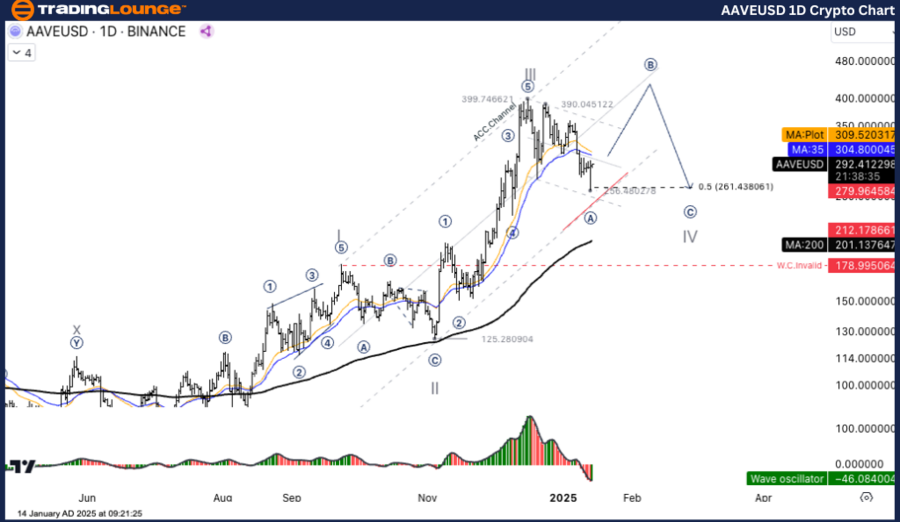
AAVE/USD (AAVEUSD) Elliott Wave Analysis TradingLounge1D Chart

AAVEUSD Elliott Wave Technical Analysis

Function: Counter Trend

Mode: Corrective

Structure: Flat

Position: Wave ((A))

Direction Next Higher Degrees: Wave (IV) of Impulse

Wave Cancel Invalid Level: 125.280

Details:

The sub-waves within Wave IV are categorized as an A-B-C Correction Pattern:

  • Wave A: Initiates a downward price movement.
  • Wave B: Expected to show a minor upward correction before continuing downward in Wave C.

AAVE/USD Trading Strategy

The current wave structure is undergoing a correction phase (Wave IV) following the completion of Wave III, which exhibited a strong uptrend.
The sub-waves within Wave IV display an A-B-C Correction Pattern:

  • Wave A: Initiates a downward correction.
  • Wave B: Anticipated to be a small upward correction before the price declines further in Wave C.
  • Wave Cancel Invalid Level: If the price falls below 178.995064, the current wave count becomes invalid.

Main Outlook:

  • Short-term: Bearish until the correction within Wave IV concludes.
  • Long-term: Upon the completion of Wave IV, the price is likely to resume its uptrend (Wave V) in a larger timeframe.

AAVEUSD-1d-crypto-ch...


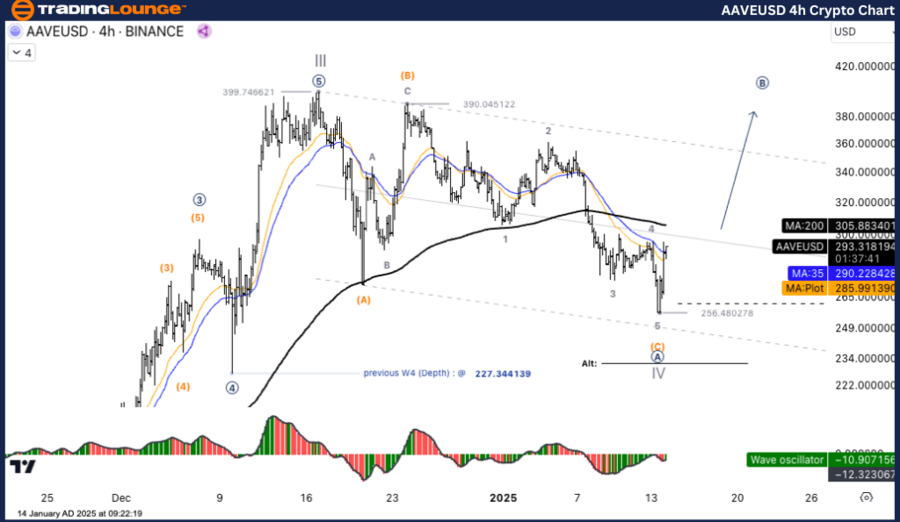
AAVE/USD (AAVEUSD) Elliott Wave Analysis TradingLounge 4H Chart

AAVEUSD Elliott Wave Technical Analysis

Function: Counter Trend

Mode: Corrective

Structure: Flat

Position: Wave ((A))

Direction Next Higher Degrees: Wave (IV) of Impulse

Wave Cancel Invalid Level: 125.280

Details:

The sub-waves within Wave IV are characterized by an A-B-C Correction Pattern:

  • Wave A: Begins with a downward correction.
  • Wave B: Projected to see a small upward correction before further price decline in Wave C.

AAVE/USD Trading Strategy

The current wave structure is part of a correction phase (Wave IV) after the culmination of a strong Wave III uptrend.
The sub-waves within Wave IV follow an A-B-C Correction Pattern:

  • Wave A: Signals the start of a downward correction.
  • Wave B: Expected to show a minor upward correction before further decline in Wave C.
  • Wave Cancel Invalid Level: A break below 178.995064 invalidates the current wave count.

Main Outlook:

  • Short-term: Bearish until the correction in Wave IV completes.
  • Long-term: Once Wave IV ends, the price is likely to re-enter its uptrend (Wave V) on a broader scale.

Technical Analyst: Kittiampon Somboonsod

Source: visit Tradinglounge.com and learn From the Experts Join TradingLounge Here 

Previous: ETHUSD Elliott Wave Technical Analysis

VALUE Offer - Buy 1 Month & Get 3 Months!Click here

Access 7 Analysts Over 200 Markets Covered. Chat Room With Support

AAVEUSD-4h-crypto-ch...

Related

British Pound/U.S. Dollar Forex Pair Market Analysis and Detailed Insight on GBPUSD Elliott Wave Technical Analysis

British Pound/U.S. Dollar Forex Pair Market Analysis and Detailed Insight on GBPUSD Elliott Wave Technical Analysis

The GBPUSD Elliott Wave analysis for both the day and 4-hour charts indicates a strong bullish trend...

Read More >
British Pound/U.S.Dollar (GBPUSD) Elliott Wave Technical Analysis 21 November 23

British Pound/U.S.Dollar (GBPUSD) Elliott Wave Technical Analysis 21 November 23

British Pound/U.S.Dollar (GBPUSD) Elliott Wave Analysis Trading Lounge Day Chart and 4-hour chart da...

Read More >
GBPUSD Elliott Wave Technical Analysis: Insights on Bearish Trends, Impulse Waves, Key Levels, and Effective Forex Trading Strategies

GBPUSD Elliott Wave Technical Analysis: Insights on Bearish Trends, Impulse Waves, Key Levels, and Effective Forex Trading Strategies

This article provides a detailed GBPUSD Elliott Wave analysis focusing on bearish trends and impulsi...

Read More >
Cocoa Elliott Wave Analysis: Price Forecast, Fibonacci Support, and Bullish Wave 3 Setup for 2024 Trading Strategy

Cocoa Elliott Wave Analysis: Price Forecast, Fibonacci Support, and Bullish Wave 3 Setup for 2024 Trading Strategy

Cocoa is currently pulling back from its all-time high, but the bullish Elliott Wave structure remai...

Read More >
BHP Group Limited Utilizes Elliott Wave theory to Provide Detailed Insights into BHP Stock Trends, Price Predictions

BHP Group Limited Utilizes Elliott Wave theory to Provide Detailed Insights into BHP Stock Trends, Price Predictions

This comprehensive analysis of ASX: BHP Group Limited utilizes Elliott Wave theory to provide detail...

Read More >
Iron Ore Commodity Elliott Wave Technical Analysis: Market Trends and Price Outlook for 2024

Iron Ore Commodity Elliott Wave Technical Analysis: Market Trends and Price Outlook for 2024

The SGX TSI Iron Ore Index has become an essential benchmark for market participants in iron ore tra...

Read More >

Buy 1 Month

Get 3 Months!

Special Offer:

Trade Recommendations

Unleash the power of deversified trading with our comprehensive portfolio, covering:

  • Stock Trades
  • Crypto Trades
  • Forex Trades
  • Commodity Trades
Elliott Wave Analysis

Gain a competive edge with expert insights in to:

  • Global Indices
  • US Stocks & ASX Stocks
  • Forex & Crypto
  • Commodities
Top-Notch Trading Tools

Equip yourself with the tools of success:

  • Social Chat
  • Elliott Wave Algorithm
  • Screener
  • TradingLevels
  • Trading Game
7 Elliott Wave Analysts

Stay ahead of the market with daily charts and insightful videos
-Your secret to strategic trading!

JOIN HERE


Welcome to TradingLounge (ASIC A.R.No. 321187), specialists in trades, trading education and technical analysis, covering stocks, indices, commodities, forex and cryptocurrencies.

When you join TradingLounge you have access to everything we offer, including trade tools, educational content and a social platform to chat with like-minded investors.

Read more

@Copyright 2024 by tradinglounge.com

Contact Us

Australian no: 02 4787 6020

International no: +61 (2) 47876020

Pay with:

Find us on