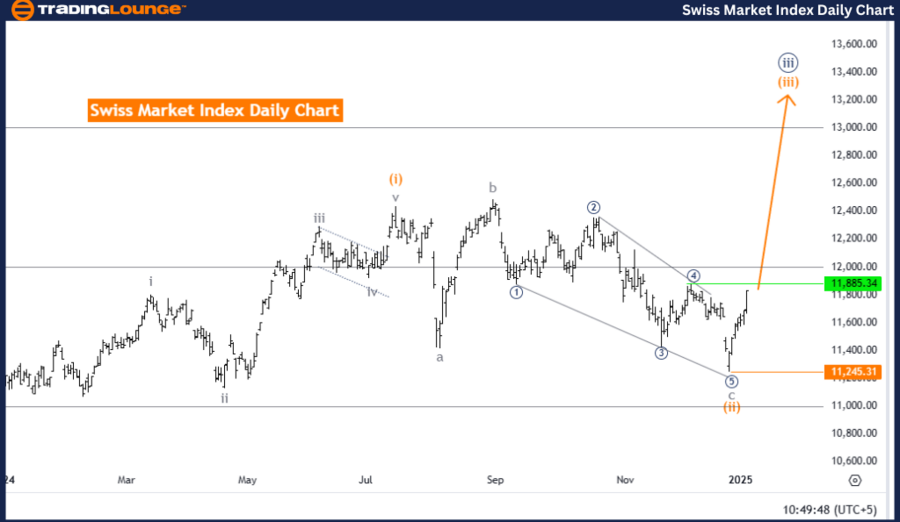
Swiss Market Index Elliott Wave Analysis - Trading Lounge Day Chart
Swiss Market Index Elliott Wave Technical Analysis
Function: Bullish Trend
Mode: Impulsive
Structure: Orange Wave 3
Position: Navy Blue Wave 3
Direction (Next Higher Degrees): Orange Wave 3 (Initiated)
Details: Orange wave 1 is complete; orange wave 3 is now in progress.
Wave Cancel Invalidation Level: 11,245.31
The Swiss Market Index (SMI) reflects a bullish trajectory, analyzed via Elliott Wave Theory on the daily chart. The index is in an impulsive phase, with orange wave 3 unfolding within the larger structure of navy blue wave 3. The transition from orange wave 1 to orange wave 3 has ignited significant upward momentum, confirming a strong bullish sentiment in the market.
Key characteristics of orange wave 3 include dynamic and extended price movements, consistent with impulsive trends in the Elliott Wave sequence. As this wave progresses, it is expected to lay the groundwork for subsequent corrective phases, maintaining the natural alternation between impulsive and corrective waves within the broader market cycle.
An invalidation level at 11,245.31 acts as a critical benchmark. A decline below this threshold would nullify the current wave structure, necessitating a fresh analysis of the market's directional trends. This benchmark is pivotal for validating the bullish outlook and guiding future market projections.
Summary
- The Swiss Market Index is advancing in a bullish impulsive phase, with orange wave 3 evolving as part of navy blue wave 3.
- This phase demonstrates significant upward market momentum in alignment with the Elliott Wave framework.
- The invalidation level (11,245.31) ensures the accuracy of the wave analysis and acts as a reference point for confirming or reassessing the market's direction.
- As orange wave 3 unfolds, it sets the stage for subsequent market phases in adherence to Elliott Wave principles.
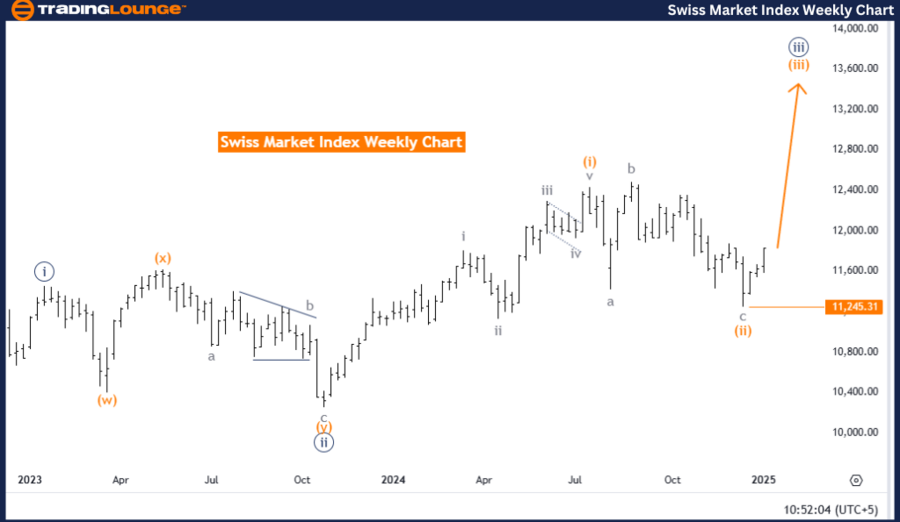
Swiss Market Index Elliott Wave Analysis - Trading Lounge Weekly Chart
Swiss Market Index Elliott Wave Technical Analysis
Function: Bullish Trend
Mode: Impulsive
Structure: Orange Wave 3
Position: Navy Blue Wave 3
Direction (Next Higher Degrees): Orange Wave 3 (Underway)
Details: Orange wave 1 is complete; orange wave 3 is now developing.
Wave Cancel Invalidation Level: 11,245.31
The Swiss Market Index (SMI) remains in a bullish trend, identified through Elliott Wave Analysis on the weekly chart. The market is experiencing an impulsive phase, driven by the ongoing development of orange wave 3, part of the broader navy blue wave 3 framework. The completion of orange wave 1 has set the stage for the robust upward trajectory now characterizing orange wave 3.
As a pivotal phase in the Elliott Wave sequence, orange wave 3 embodies strong and sustained price movements indicative of bullish trends. This wave underscores market strength and serves as a foundation for either future corrective phases or continued impulsive growth, aligning with the overall bullish structure.
The invalidation level, set at 11,245.31, provides a critical point of reference. A breach below this level invalidates the current wave interpretation, requiring a reassessment of the market’s structure and trajectory. This benchmark is integral to maintaining analytical accuracy and ensuring the reliability of the bullish projection.
Summary
- The Swiss Market Index continues its bullish impulsive phase, with orange wave 3 advancing as a segment of navy blue wave 3.
- This phase signifies strong upward momentum, consistent with Elliott Wave principles.
- The invalidation level (11,245.31) is a key metric to validate the ongoing wave structure and guide expectations for market movements.
- The progress of orange wave 3 reinforces the bullish outlook, adhering to the natural cycles outlined in Elliott Wave Theory.
Technical Analyst: Malik Awais
Source: visit Tradinglounge.com and learn From the Experts Join TradingLounge Here
Previous: KOSPI Composite Elliott Wave Technical Analysis
VALUE Offer - Buy 1 Month & Get 3 Months!Click here
Access 7 Analysts Over 200 Markets Covered. Chat Room With Support