TradingLounge Commodity: Soybeans Elliott Wave Analysis

Function - Trend

Mode - Impulse

Structure - Impulse for wave (3)

Position - Wave 1 of (3)

Direction - Wave 1 of (3) is still in play

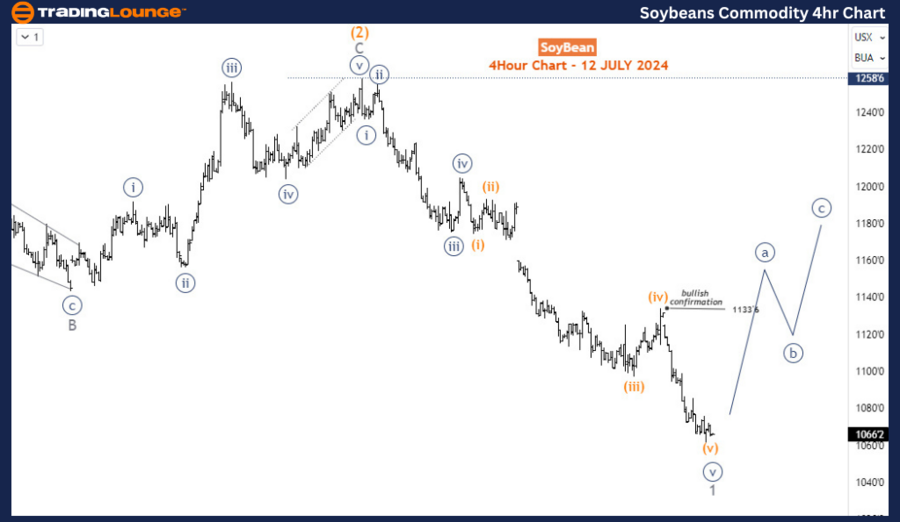
Details - Wave 1 is nearing completion, after which wave 2 bullish correction begins. The confirmation level remains above 1133’6.

Soybeans Elliott Wave Technical Analysis

Soybean prices have dropped to their lowest levels since October 2020, continuing the long-term bearish trend that began in June 2022. In the short term, the current decline started in May 2024, erasing the recovery from February to March 2024. While a corrective bounce may occur soon, traders should expect this commodity to maintain its gradual sell-off in the coming months.

Daily Chart Analysis

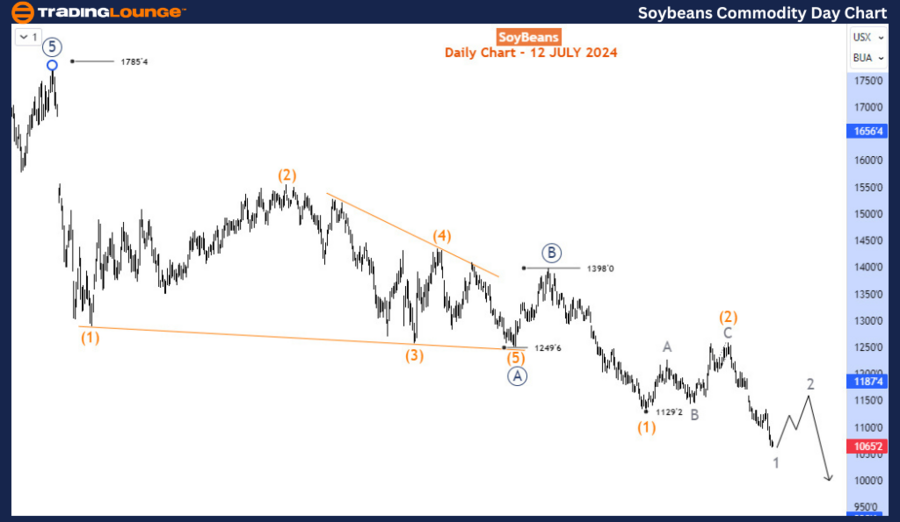
On the daily chart, a bullish impulse structure that began in May 2019 was completed at 1785 in June 2022. Since reaching that peak, the price has been correcting the bullish trend. The daily chart illustrates the structure emerging for this corrective bearish phase. The decline from 1785 is evolving into a zigzag A-B-C (circled) structure. Wave A and B (circled) ended at 1249 (October 2023 low) and 1398 (November 2023 high), respectively. From 1398, wave C (circled) is emerging downwards. Within wave C, the price has completed waves (1) and (2) of 5 (circled) and is now progressing into wave 1 of (3). Eventually, the commodity is expected to collapse below 1000 in wave 3. However, a corrective bounce for wave 2 should precede that.
Soybeans-Commodity-D...


H4 Chart Analysis

On the H4 chart, wave 1 appears to be nearing completion of an impulse wave structure, with an extended fifth sub-wave. A bullish confirmation for wave 2 is needed. The best trade idea here is to wait for the end of wave 2 and then find SHORT opportunities into wave 3 of (3), provided that the 1288 wave (2) high is not breached.

Conclusion

Both the daily and H4 charts indicate a continued bearish trend for Soybean, with the price nearing significant support levels. The evolving zigzag structure on the daily chart suggests that the long-term corrective phase is still in progress, while the H4 chart outlines the final stages of wave 1 and the anticipated corrective bounce in wave 2. By closely monitoring the completion of wave 1 on the H4 chart and the overall zigzag pattern on the daily chart, traders can identify strategic entry points to capitalize on the anticipated decline. The upcoming wave 2 corrective bounce provides a potential opportunity for traders to position themselves for the next leg down in wave 3, aiming for targets below 1000. This strategic approach ensures that traders can maximize their returns while navigating the ongoing bearish trend in the Soybean market.

Technical Analyst: Sanmi Adeagbo

Source: visit Tradinglounge.com and learn From the Experts Join TradingLounge Here 

See Previous: Wheat Elliott Wave Technical Analysis

Special Trial Offer - 0.76 Cents a Day for 3 Months! Click here

Access 7 Analysts Over 170 Markets Covered. Chat Room With Support
Soybeans-Commodity-4...

Related

Elliott Wave Technical Analysis Reveals AUDJPY Trading Trends and Forecasts

Elliott Wave Technical Analysis Reveals AUDJPY Trading Trends and Forecasts

Our AUD/JPY Elliott Wave Analysis on the 4-hour chart suggests a trend scenario marked by impulsive ...

Read More >
Diminishing Trading Volume Hints at Market Top Ahead of Tech Giants' Earnings

Diminishing Trading Volume Hints at Market Top Ahead of Tech Giants' Earnings

Over the past two months, trading volumes for the S&P 500 (SPX) and the NASDAQ 100 (NDX) have been d...

Read More >
DOW JONES Market Analysis - DJI Index Elliott Wave Technical Analysis | Dow Jones Stocks financial news

DOW JONES Market Analysis - DJI Index Elliott Wave Technical Analysis | Dow Jones Stocks financial news

This analysis provides an in-depth look at the Dow Jones DJI using Elliott Wave theory on day and we...

Read More >
Commodities & Futures Market Analysis: Elliott Wave Insights & Strategies

Commodities & Futures Market Analysis: Elliott Wave Insights & Strategies

Discover profitable opportunities in the Commodities and Futures Trading Market with our comprehen...

Read More >
British Pound/Japanese Yen (GBPJPY) Forex Elliott Wave Technical Analysis: Expert Strategies and Accurate Forecasts

British Pound/Japanese Yen (GBPJPY) Forex Elliott Wave Technical Analysis: Expert Strategies and Accurate Forecasts

Explore comprehensive GBPJPY Elliott Wave Analysis on daily and 4-hour charts. Understand the correc...

Read More >
Learn effective forex trading strategies: Euro/U.S.Dollar(EURUSD) Forex Elliott Wave Technical Analysis

Learn effective forex trading strategies: Euro/U.S.Dollar(EURUSD) Forex Elliott Wave Technical Analysis

Our detailed EURUSD Elliott Wave Analysis provides essential insights for traders, using Elliott Wav...

Read More >

Buy 1 Month

Get 3 Months!

Special Offer:

Trade Recommendations

Unleash the power of deversified trading with our comprehensive portfolio, covering:

  • Stock Trades
  • Crypto Trades
  • Forex Trades
  • Commodity Trades
Elliott Wave Analysis

Gain a competive edge with expert insights in to:

  • Global Indices
  • US Stocks & ASX Stocks
  • Forex & Crypto
  • Commodities
Top-Notch Trading Tools

Equip yourself with the tools of success:

  • Social Chat
  • Elliott Wave Algorithm
  • Screener
  • TradingLevels
  • Trading Game
7 Elliott Wave Analysts

Stay ahead of the market with daily charts and insightful videos
-Your secret to strategic trading!

JOIN HERE


Welcome to TradingLounge (ASIC A.R.No. 321187), specialists in trades, trading education and technical analysis, covering stocks, indices, commodities, forex and cryptocurrencies.

When you join TradingLounge you have access to everything we offer, including trade tools, educational content and a social platform to chat with like-minded investors.

Read more

@Copyright 2024 by tradinglounge.com

Contact Us

Australian no: 02 4787 6020

International no: +61 (2) 47876020

Pay with:

Find us on