USDJPY Elliott Wave Analysis Trading Lounge Day Chart, 24 July 2023, 
U.S.Dollar/ Japanese Yen  (USDJPY)  Day Chart
USDJPY Elliott Wave Technical Analysis
Function:  CounterTrend
Mode: corrective
Structure:  Zigzag
Position: Black Subwave 2 of Red wave 3 
Direction Next lower Degrees:Black wave 3  of Motive
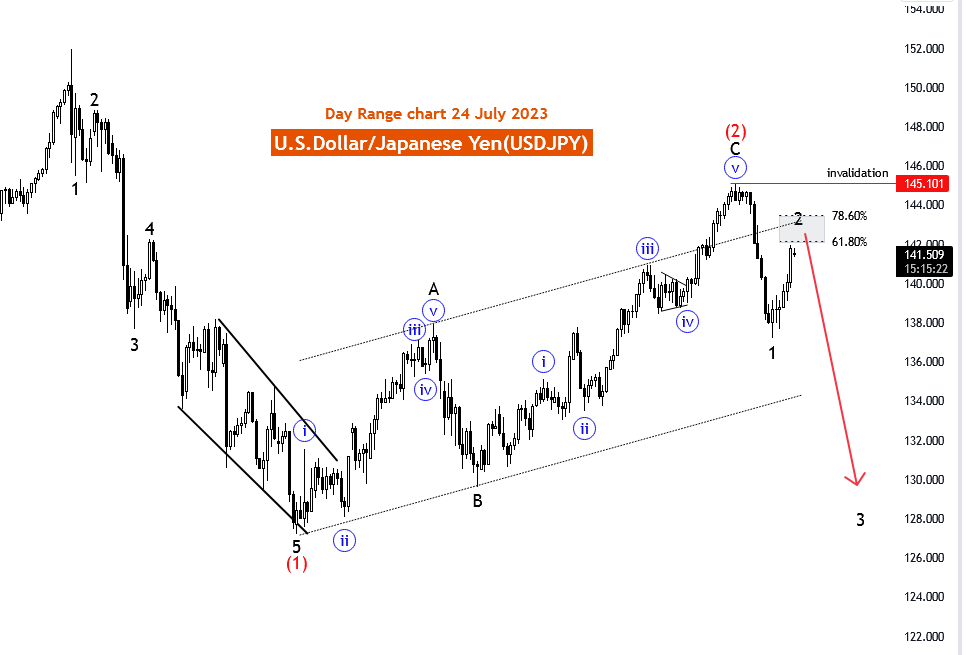
Details: After corrective wave 2 Black Subwave Wave “3 of red wave 3” started. Subwave Wave “2”  is likely to end between fib level 61.80 to 78.60. Wave Cancel invalid level: 145.101

On 24th July 2023, the day chart of the U.S. Dollar/Japanese Yen (USDJPY) pair is analyzed using Elliott Wave theory, revealing a counter-trend movement with a corrective mode. The function of the price movement is identified as a counter-trend, while the mode is characterized as corrective.
The current structure is recognized as a Zigzag pattern, with the position of the price wave designated as Black Subwave 2 of Red wave 3. The projected direction for the next lower degrees is Black wave 3 of a larger Motive wave pattern.
The analysis provides further details, indicating that after the completion of corrective wave 2, Black Subwave Wave "3 of red wave 3" has started. Traders and investors are advised to closely monitor the market, as Subwave Wave "2" is expected to conclude between the Fibonacci levels of 61.80 to 78.60.
It is essential to note that the wave count provided will lose its validity if the USDJPY price falls below the level of 145.101.
As of the specified date, 24th July 2023, traders in the USDJPY market should closely observe the counter-trend corrective movement and wait for confirmation of the end of Subwave Wave "2" before considering potential trading opportunities. Corrective waves can be challenging to navigate, as they involve identifying potential reversals and require cautious risk management practices.
The analysis also hints at the continuation of the larger Motive wave pattern with Black wave 3, suggesting the potential for a stronger directional move after the completion of Subwave Wave "2."
While Elliott Wave analysis provides valuable insights into market patterns and potential price movements, it should be complemented with other technical indicators and fundamental factors to develop a comprehensive trading strategy. Economic data releases, geopolitical events, and shifts in market sentiment can significantly impact currency pairs like USDJPY, making it crucial for traders to stay informed and adaptive to changing market conditions.
By utilizing proper risk management and combining various forms of analysis, traders can make more informed decisions and improve their trading performance in the dynamic forex markets.

JOIN HERE TradingLounge Full access to 4 analysts covering Forex, Crypto, Stocks, Indices and commodities

U.S.Dollar/ Japanese Yen  (USDJPY)  Day Chart

usdjpydaychart

Related

Elliott Wave Analysis: How CPI Figures Impact S&P 500, NASDAQ, DAX 40, and More

Elliott Wave Analysis: How CPI Figures Impact S&P 500, NASDAQ, DAX 40, and More

The latest Elliott Wave Analysis indicates a market response to rising CPI figures, leading to a dow...

Read More >
Polkadot/U.S. dollar(DOTUSD) Elliott Wave Technical Analysis 1 February 24

Polkadot/U.S. dollar(DOTUSD) Elliott Wave Technical Analysis 1 February 24

TradingLounge Polkadot technical analysis today using Polkadot/US dollar(DOTUSD) Elliott Wave Analys...

Read More >
Elliott Wave Analysis: NASDAQ 100 and Major Stocks Including AAPL, TSLA, AMZN Poised for Movements

Elliott Wave Analysis: NASDAQ 100 and Major Stocks Including AAPL, TSLA, AMZN Poised for Movements

This analysis offers an Elliott Wave perspective on the NASDAQ stock market, forecasting upward tren...

Read More >
Understand the best Strategies for Navigating Bitcoin’s Price Action: Elliott Wave Analysis and BTCUSD Technical Trends

Understand the best Strategies for Navigating Bitcoin’s Price Action: Elliott Wave Analysis and BTCUSD Technical Trends

This article offers in-depth Bitcoin Elliott Wave analysis, focusing on BTCUSD technical trends, pri...

Read More >
Berkshire Hathaway Inc.(BRK.B:NYSE) Elliott Wave Technical Analysis 10 November 23

Berkshire Hathaway Inc.(BRK.B:NYSE) Elliott Wave Technical Analysis 10 November 23

Berkshire Hathaway Inc.(BRK.B:NYSE) Elliott Wave Technical Analysis 10 November 23 shows Stock Marke...

Read More >
James Hardie Industries PLC (JHX) Elliott Wave Analysis: ASX Stock Forecast, Market Trends & Technical Trading Strategy

James Hardie Industries PLC (JHX) Elliott Wave Analysis: ASX Stock Forecast, Market Trends & Technical Trading Strategy

James Hardie Industries PLC (JHX) Elliott Wave technical analysis provides an in-depth ASX stock for...

Read More >

Buy 1 Month

Get 3 Months!

Special Offer:

Trade Recommendations

Unleash the power of deversified trading with our comprehensive portfolio, covering:

  • Stock Trades
  • Crypto Trades
  • Forex Trades
  • Commodity Trades
Elliott Wave Analysis

Gain a competive edge with expert insights in to:

  • Global Indices
  • US Stocks & ASX Stocks
  • Forex & Crypto
  • Commodities
Top-Notch Trading Tools

Equip yourself with the tools of success:

  • Social Chat
  • Elliott Wave Algorithm
  • Screener
  • TradingLevels
  • Trading Game
7 Elliott Wave Analysts

Stay ahead of the market with daily charts and insightful videos
-Your secret to strategic trading!

JOIN HERE


Welcome to TradingLounge (ASIC A.R.No. 321187), specialists in trades, trading education and technical analysis, covering stocks, indices, commodities, forex and cryptocurrencies.

When you join TradingLounge you have access to everything we offer, including trade tools, educational content and a social platform to chat with like-minded investors.

Read more

@Copyright 2024 by tradinglounge.com

Contact Us

Australian no: 02 4787 6020

International no: +61 (2) 47876020

Pay with:

Find us on