03Feb

Alphabet Inc.(GOOGL) Stocks Elliott Wave Technical Analysis To Identify Key Entry and Exit Points While Monitoring Market Trends

GOOGL Elliott Wave Analysis – Daily & 1-Hour Chart Overview

This Elliott Wave analysis for Alphabet Inc. (GOOGL) evaluates both the daily and 1-hour charts to determine the current market trend. Utilizing Elliott Wave Theory, we aim to forecast potential future price movements.


GOOGL Elliott Wave Analysis - Trading Lounge Daily Chart

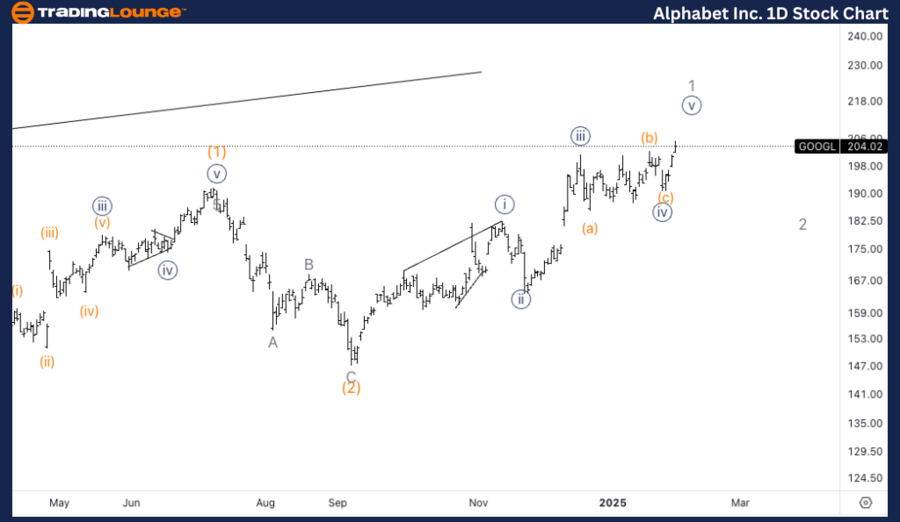
Alphabet Inc. (GOOGL) Daily Chart Analysis

GOOGL Elliott Wave Technical Analysis

Function: Trend

Mode: Impulsive

Structure: Motive

Position: Minor wave 1

Direction: Upside within wave {v} of 1

Details:
GOOGLE is currently in an upward move within wave 1 of (3), aligning with a conservative outlook. As the stock hovers around the $200 level, there is a possibility of a larger pullback, likely forming wave 2. This suggests that a short-term correction might take place before the next bullish wave initiates.


GOOGL Elliott Wave Technical Analysis – Daily Chart

Alphabet Inc. (GOOGL) continues its impulsive rally as it progresses through wave 1 of (3). The $200 price level remains a key psychological barrier, and a potential retracement into wave 2 could emerge before the next bullish phase begins. This wave structure aligns with Elliott Wave Theory, indicating further upside momentum in the long term.

Alphabet-Inc-1D-Stoc...


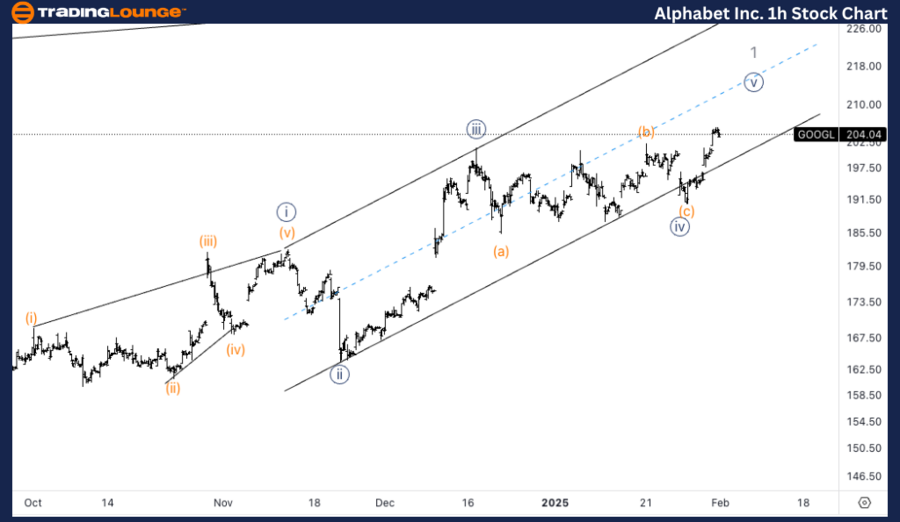
Alphabet Inc. (GOOGL) 1H Chart Analysis

GOOGL Elliott Wave Technical Analysis

Function: Trend

Mode: Impulsive

Structure: Motive

Position: Wave (iii) of {v}

Direction: Targeting the top in wave {v}

Details:
GOOGL is expected to continue its upward trajectory into wave {v}, with parallel trend channel support reinforcing confidence in this Elliott Wave count. This bullish setup suggests that the current structure may see further gains before a possible retracement.


GOOGL Elliott Wave Technical Analysis – 1H Chart

The short-term Elliott Wave outlook for GOOGL anticipates an extension into wave {v}, supported by trend channel strength. As this pattern unfolds, the stock could see additional gains before encountering resistance, leading to a potential pullback. Traders should monitor key support levels to confirm the ongoing bullish wave progression.

Technical Analyst: Alessio Barretta

Source: visit Tradinglounge.com and learn From the Experts Join TradingLounge Here 

See Previous: McDonald’s Corp. Elliott Wave Technical Analysis

VALUE Offer - Buy 1 Month & Get 3 Months!Click here

Access 7 Analysts Over 200 Markets Covered. Chat Room With Support

Alphabet-Inc-1h-Stoc...

Related

Predicting the Breakout Direction: Gold (XAUUSD) Elliott Wave Technical Analysis

Predicting the Breakout Direction: Gold (XAUUSD) Elliott Wave Technical Analysis

while gold remains trapped in a range for now, the anticipation of a breakout looms large. With care...

Read More >
U.S. Dollar / Japanese Yen (USDJPY) Elliott Wave Analysis: Daily & 4-Hour Chart Insights on Corrective Phases and Bullish Trends

U.S. Dollar / Japanese Yen (USDJPY) Elliott Wave Analysis: Daily & 4-Hour Chart Insights on Corrective Phases and Bullish Trends

USDJPY Elliott Wave Analysis offers an in-depth look at the daily and 4-hour charts. The report pred...

Read More >
U.S. Dollar / Japanese Yen Forex Elliott Wave Technical Analysis: USDJPY Forecast and Effective Trading Strategies

U.S. Dollar / Japanese Yen Forex Elliott Wave Technical Analysis: USDJPY Forecast and Effective Trading Strategies

The USDJPY Elliott Wave analysis provides an in-depth look at the current corrective phase, highligh...

Read More >
Risk Management Strategies for Australian Dollar/U.S. Dollar: AUD/USD Forex Elliott Wave Technical Analysis

Risk Management Strategies for Australian Dollar/U.S. Dollar: AUD/USD Forex Elliott Wave Technical Analysis

Discover the latest AUD/USD Elliott Wave analysis focusing on day and 4-hour chart insights. Learn a...

Read More >
Alphabet Inc.(GOOGL:NASDAQ) Elliott Wave Technical Analysis 4 December 23

Alphabet Inc.(GOOGL:NASDAQ) Elliott Wave Technical Analysis 4 December 23

Alphabet Inc.(GOOGL: NASDAQ) Elliott Wave Technical Analysis dated 4 December 23 includes Stock Mark...

Read More >
EURUSD Elliott Wave Analysis: Covers Essential Technical Analysis Techniques to help Improve Decision Making in the Forex Market

EURUSD Elliott Wave Analysis: Covers Essential Technical Analysis Techniques to help Improve Decision Making in the Forex Market

This article offers a detailed EURUSD Elliott Wave Analysis, providing traders with key insights int...

Read More >

Buy 1 Month

Get 3 Months!

Special Offer:

Trade Recommendations

Unleash the power of deversified trading with our comprehensive portfolio, covering:

  • Stock Trades
  • Crypto Trades
  • Forex Trades
  • Commodity Trades
Elliott Wave Analysis

Gain a competive edge with expert insights in to:

  • Global Indices
  • US Stocks & ASX Stocks
  • Forex & Crypto
  • Commodities
Top-Notch Trading Tools

Equip yourself with the tools of success:

  • Social Chat
  • Elliott Wave Algorithm
  • Screener
  • TradingLevels
  • Trading Game
7 Elliott Wave Analysts

Stay ahead of the market with daily charts and insightful videos
-Your secret to strategic trading!

JOIN HERE


Welcome to TradingLounge (ASIC A.R.No. 321187), specialists in trades, trading education and technical analysis, covering stocks, indices, commodities, forex and cryptocurrencies.

When you join TradingLounge you have access to everything we offer, including trade tools, educational content and a social platform to chat with like-minded investors.

Read more

@Copyright 2024 by tradinglounge.com

Contact Us

Australian no: 02 4787 6020

International no: +61 (2) 47876020

Pay with:

Find us on