McDonald’s Corp. (MCD) Elliott Wave Analysis – TradingLounge Daily Chart
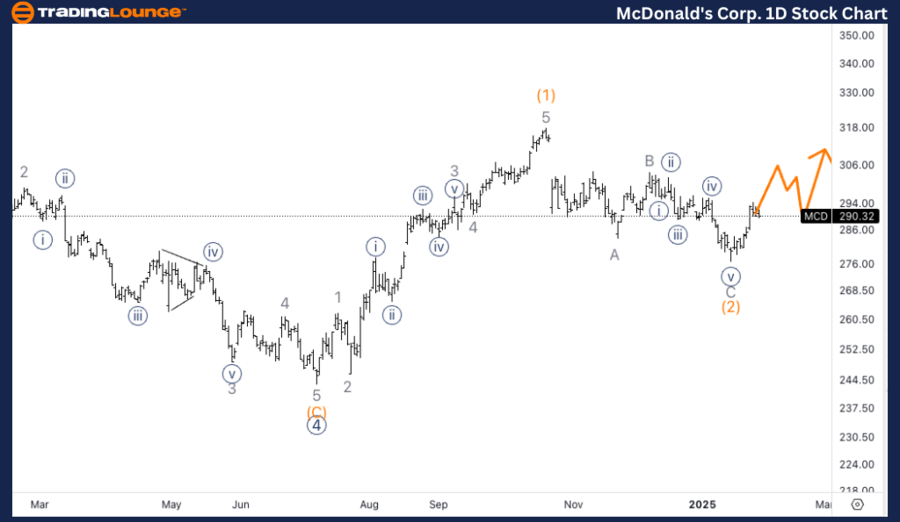
McDonald’s Corp. Stock Daily Chart Analysis
MCD Elliott Wave Technical Analysis
Function: Trend
Mode: Impulsive
Structure: Motive
Position: Wave (3) of 5
Direction: Bullish continuation within wave (3)
Details:
- Monitoring wave (2) bottom confirmation following a distinct three-wave retracement.
- Expecting further bullish momentum as wave 1 of (3) develops, confirming the uptrend of wave (3).
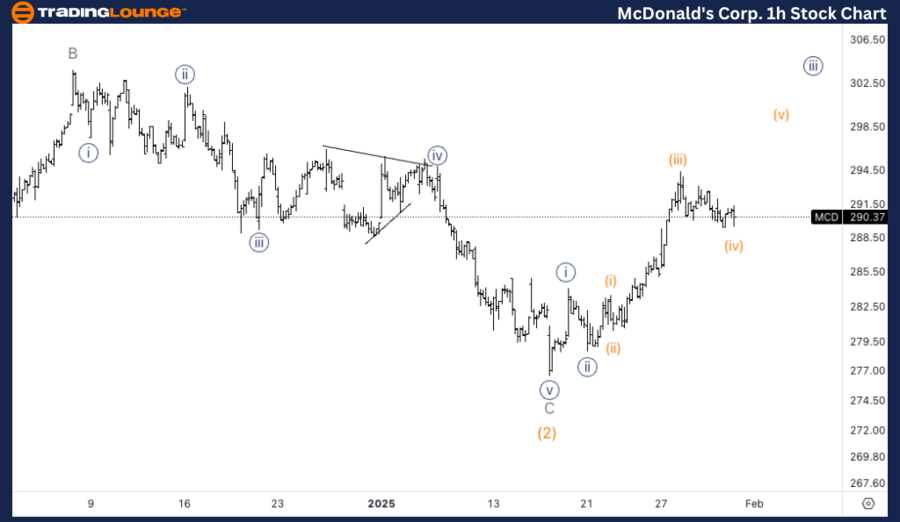
McDonald’s Corp. (MCD) Elliott Wave Analysis – TradingLounge 1-Hour Chart
MCD Elliott Wave Technical Analysis
Function: Trend
Mode: Impulsive
Structure: Motive
Position: Wave (iv) of {iii}
Direction: Bullish continuation into wave (v)
Details:
Technical Analyst: Alessio Barretta
Source: visit Tradinglounge.com and learn From the Experts Join TradingLounge Here
See Previous: PayPal Holdings Inc. Elliott Wave Technical Analysis
VALUE Offer - Buy 1 Month & Get 3 Months!Click here
Access 7 Analysts Over 200 Markets Covered. Chat Room With Support
Market Insight & Summary
This Elliott Wave Analysis of McDonald's Corp. (MCD) provides a structured outlook based on both daily and 1-hour charts. The analysis highlights key trend formations, corrective structures, and impulsive waves, helping traders identify potential trading opportunities. The broader S&P 500 analysis reflects a combination of trend continuation and market corrections, offering valuable insights for market participants navigating different Elliott Wave cycles.