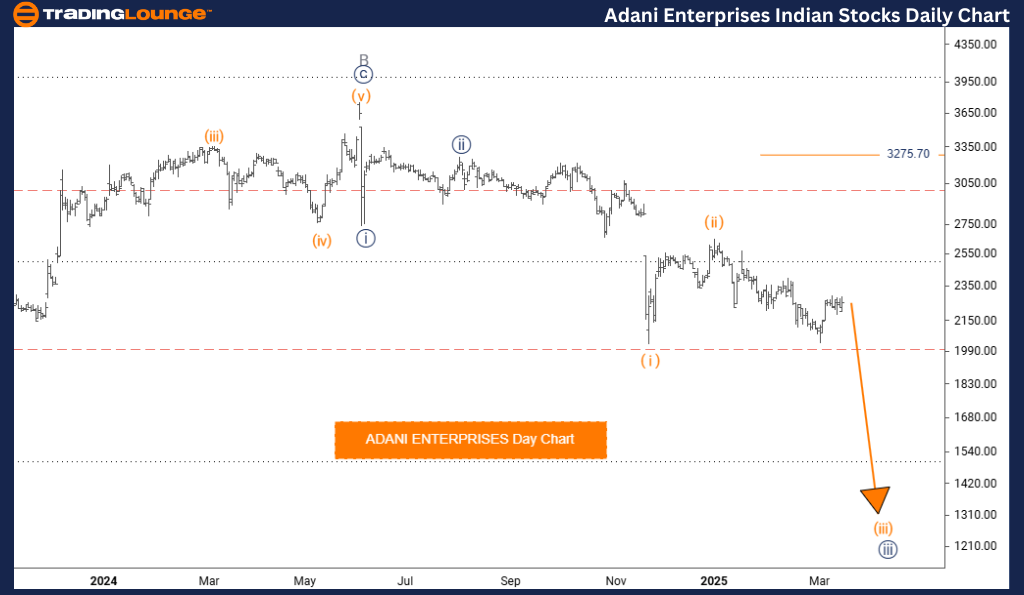
ADANI ENTERPRISES Elliott Wave Analysis – Trading Lounge Day Chart
ADANI ENTERPRISES Elliott Wave Technical Analysis
Function: Trend
Mode: Impulsive
Structure: Orange Wave 3
Position: Navy Blue Wave 3
Next Higher Degree Direction: Orange Wave 4
Invalidation Level: 3275.70
Analysis Overview
The ADANI ENTERPRISES Elliott Wave Analysis on the daily chart offers key insights into the stock’s ongoing trend and future market direction.
- The market is currently in a trending phase with impulsive price action, indicating strong directional momentum.
- The primary wave structure under evaluation is Orange Wave 3, which plays a crucial role within the broader Navy Blue Wave 3.
- Following the completion of Orange Wave 2, the market is now advancing into Orange Wave 3, which is anticipated to show strong bullish momentum before transitioning to the next phase.
- Orange Wave 4 is expected to emerge once Orange Wave 3 reaches completion.
- The invalidation level at 3275.70 serves as a critical point. If breached, the current wave analysis would be invalidated, indicating a potential change in trend structure.
Market Insights & Trading Strategy
The ADANI ENTERPRISES Elliott Wave daily chart analysis helps traders understand short-term market movements and adapt their strategies accordingly.
- By focusing on wave patterns and key market levels, traders can identify potential entry and exit points.
- The transition from Orange Wave 3 to Orange Wave 4 will be pivotal in determining the next directional movement.
- Risk management remains essential, with traders advised to monitor the invalidation level and adjust strategies as needed.
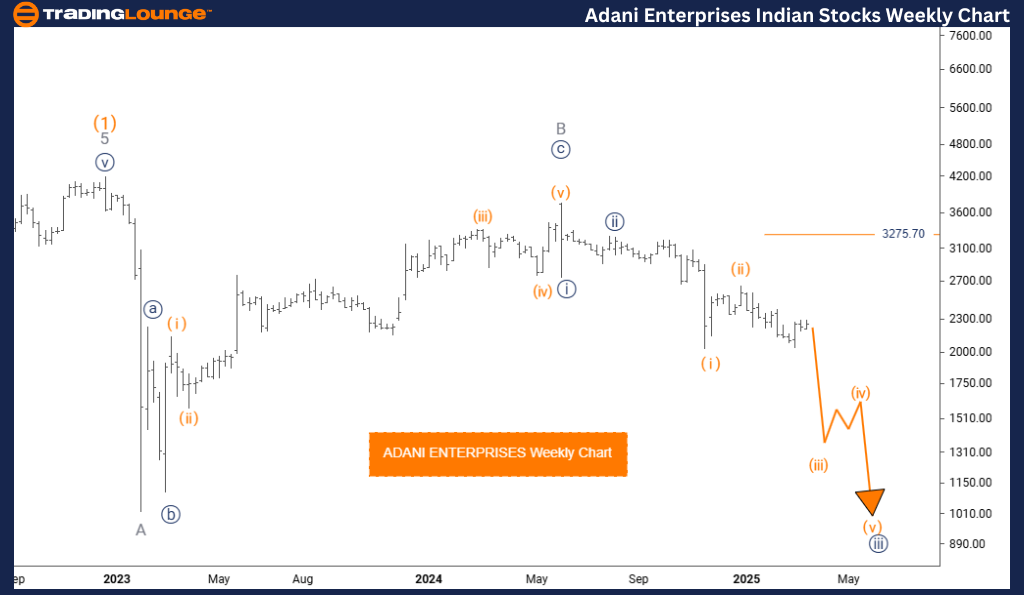
ADANI ENTERPRISES Elliott Wave Analysis – Trading Lounge Weekly Chart
ADANI ENTERPRISES Elliott Wave Technical Analysis
Function: Trend
Mode: Impulsive
Structure: Orange Wave 3
Position: Navy Blue Wave 3
Next Higher Degree Direction: Orange Wave 4
Invalidation Level: 3275.70
Analysis Overview
The ADANI ENTERPRISES Elliott Wave Analysis on the weekly chart provides a broader outlook on the stock’s market structure and long-term trend potential.
- The market remains in a strong uptrend, characterized by impulsive price movements within Orange Wave 3.
- This wave is nested within Navy Blue Wave 3, signifying its importance within the larger Elliott Wave count.
- With Orange Wave 2 completed, the market is now progressing through Orange Wave 3, which is expected to be a key bullish phase before a correction.
- The next phase to watch is Orange Wave 4, which may introduce a retracement or consolidation after the completion of Wave 3.
- The invalidation level remains at 3275.70, acting as a critical support for maintaining the current wave outlook.
Market Insights & Trading Strategy
The weekly chart analysis offers traders a long-term perspective, helping them align strategies with major market trends.
- Understanding the Elliott Wave structure enables traders to anticipate key market turning points.
- Identifying the completion of impulsive waves and the beginning of corrective phases allows traders to make informed decisions.
- Monitoring the transition from Orange Wave 3 to Orange Wave 4 is crucial for those looking to optimize entry and exit strategies.
Technical Analyst: Malik Awais
Source: visit Tradinglounge.com and learn From the Experts Join TradingLounge Here
Previous:ADANI GREEN Elliott Wave Technical Analysis
VALUE Offer - Buy 1 Month & Get 3 Months!Click here
Access 7 Analysts Over 200 Markets Covered. Chat Room With Support