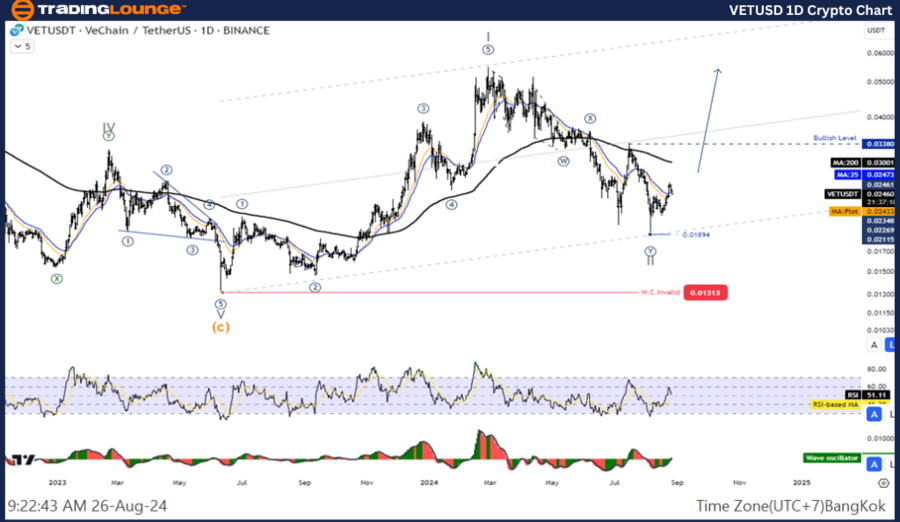
VETUSD Elliott Wave Analysis | TradingLounge Daily Chart

VeChain (VET) to U.S. Dollar (VETUSD) Daily Chart Analysis

VETUSD Elliott Wave Technical Analysis

  • Function: Counter Trend
  • Mode: Corrective
  • Structure: Double Corrective
  • Position: Wave ((Y))
  • Next Higher Degree Direction: Wave II of Impulse
  • Invalidation Level: N/A
  • Details: Wave II appears complete, and the price is expected to increase in Wave III.

VeChain (VET) Trading Strategy Against USD:

VeChain’s primary trend may have concluded, with Wave 1 likely completed. The current price action suggests entry into a corrective Wave 2, anticipated to test the 50-61.8% retracement level of Wave 1 before resuming an upward trajectory in Wave 3. Traders should watch for opportunities to re-enter the trend during this correction.

VeChain (VET) Technical Indicators:

  • Price Relative to MA200: Below the 200-day Moving Average, indicating a downtrend.

  • Wave Oscillator: Bearish Momentum.

VETUSD-1D-Crypto-Cha...


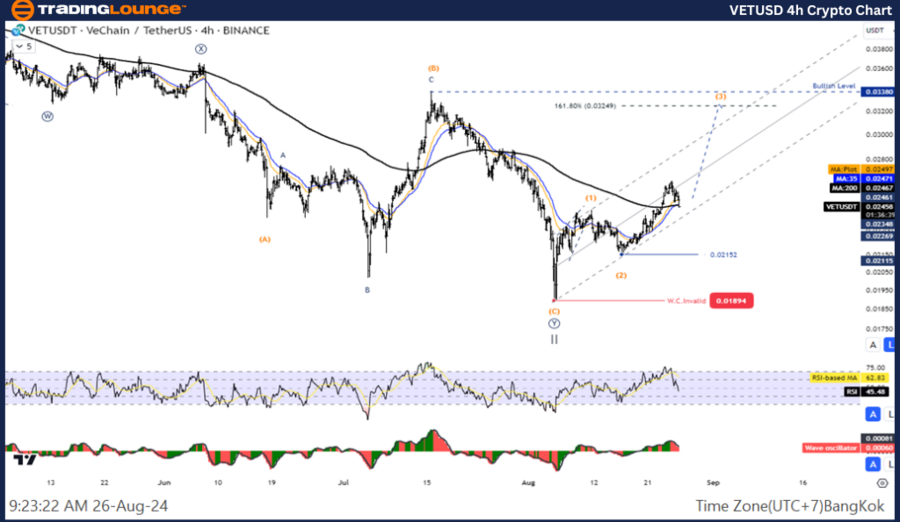
VETUSD Elliott Wave Analysis | TradingLounge H4 Chart

VeChain (VET) to U.S. Dollar (VETUSD) 4-Hour Chart Analysis

VETUSD Elliott Wave Technical Analysis

  • Function: Counter Trend
  • Mode: Corrective
  • Structure: Double Corrective
  • Position: Wave ((Y))
  • Next Higher Degree Direction: Wave II of Impulse
  • Invalidation Level: N/A
  • Details: Wave II appears complete, and the price is expected to increase in Wave III.

VeChain (VET) Trading Strategy Against USD:

VeChain’s primary trend may have concluded, with Wave 1 likely completed. The current price action suggests entry into a corrective Wave 2, anticipated to test the 50-61.8% retracement level of Wave 1 before resuming an upward trajectory in Wave 3. Traders should watch for opportunities to re-enter the trend during this correction.

VeChain (VET) Technical Indicators:

  • Price Relative to MA200: Below the 200-period Moving Average, indicating a downtrend.
  • Wave Oscillator: Bullish Momentum.

Technical Analyst:  Kittiampon Somboonsod

Source: visit Tradinglounge.com and learn From the Experts Join TradingLounge Here 

See Previous: AAVEUSD Elliott Wave Technical Analysis

Special Trial Offer - 0.76 Cents a Day for 3 Months! Click here

Access 7 Analysts Over 200 Markets Covered. Chat Room With Support

VETUSD-4h-Crypto-Cha...

Related

Australian Dollar/U.S.Dollar (AUDUSD) Forex Elliott Wave Technical Analysis: In-depth Trading Lounge Chart Overview

Australian Dollar/U.S.Dollar (AUDUSD) Forex Elliott Wave Technical Analysis: In-depth Trading Lounge Chart Overview

This article provides an in-depth Elliott Wave analysis of the AUDUSD pair, featuring key insights i...

Read More >
Texas Instruments (TXN) Stock Ready for a Breakout? TXN Elliott Wave Technical Analysis Reveals Key Levels and Price Trends!

Texas Instruments (TXN) Stock Ready for a Breakout? TXN Elliott Wave Technical Analysis Reveals Key Levels and Price Trends!

This Texas Instruments (TXN) Elliott Wave analysis examines TXN stock price trends, identifying key ...

Read More >
Natural Gas Commodity Elliottwave Technical Analysis: Potential Implications for Future Price Movements

Natural Gas Commodity Elliottwave Technical Analysis: Potential Implications for Future Price Movements

This article provides a comprehensive Elliott Wave analysis of the natural gas market. It discusses ...

Read More >
S&P 500 Elliott Wave Analysis: Gray Wave 2 Correction, Orange Wave 5 Forecast, Market Trends, and Trading Strategies

S&P 500 Elliott Wave Analysis: Gray Wave 2 Correction, Orange Wave 5 Forecast, Market Trends, and Trading Strategies

The S&P 500 Elliott Wave analysis focuses on the current corrective phase of Gray Wave 2 and the bul...

Read More >
Costco Wholesale Corp. (COST) Elliott Wave Analysis: Stock Forecast, Key Resistance Levels, and Market Outlook for Investors

Costco Wholesale Corp. (COST) Elliott Wave Analysis: Stock Forecast, Key Resistance Levels, and Market Outlook for Investors

This Costco (COST) Elliott Wave analysis provides a detailed look at the stock's current wave st...

Read More >
ASX: CAR GROUP LIMITED – CAR Stock Analysis & Elliott Wave Technical Analysis Suggests Wave Correction Completes

ASX: CAR GROUP LIMITED – CAR Stock Analysis & Elliott Wave Technical Analysis Suggests Wave Correction Completes

CAR Group (ASX: CAR) shows signs of completing a wave (4) correction, setting up for a bullish wave ...

Read More >

$1 for 2 Weeks

then $29 a month!

What a Special Offer!

Trade Recommendations

Unleash the power of deversified trading with our comprehensive portfolio, covering 250+ markets:

  • Stock Trades
  • Crypto Trades
  • Forex Trades
  • Commodity Trades
Elliott Wave Analysis

Gain a competitive edge with expert insights and AI-powered Elliott Wave charting into:

  • Global Indices
  • US Stocks & ASX Stocks
  • Forex & Crypto
  • Commodities
Top-Notch Trading Tools

Equip yourself with the tools of success:

  • Real-time Chat rooms
  • Elliott Wave Algorithm
  • Portfolio tools
  • TradingLevels
  • Screener
  • Trading Game
7 Elliott Wave Analysts

Stay ahead of the market with daily charts and insightful videos
Your secret to strategic trading!

JOIN HERE


Welcome to TradingLounge (ASIC A.R.No. 321187), specialists in trades, trading education and technical analysis, covering stocks, indices, commodities, forex and cryptocurrencies.

When you join TradingLounge you have access to everything we offer, including trade tools, educational content and a social platform to chat with like-minded investors.

Read more

@Copyright 2024 by tradinglounge.com

Contact Us

Australian no: 02 4787 6020

International no: +61 (2) 47876020

Pay with:

Find us on